Measuring risk before it becomes harm.
Executive summary
A single number can’t tell you what’s about to happen
For most of the past decade, road safety performance in Great Britain has been judged by one figure: the number of people killed or seriously injured in the preceding year. That figure describes the network faithfully — but only once the harm has been done.
Safety Performance Indicators (SPIs) exist to close that gap. They make it possible to observe risk as it accumulates, rather than count its consequences after the event. The Department for Transport’s Road Safety Strategy, published on 7 January 2026, puts SPIs at the centre of national policy for the first time — though Scotland has taken this approach for over five years already. The strategy sets two targets against a 2022–2024 baseline: a 65% reduction in KSI casualties and a 70% reduction in child KSI casualties, both by 2035 — the first national casualty reduction targets in 15 years.
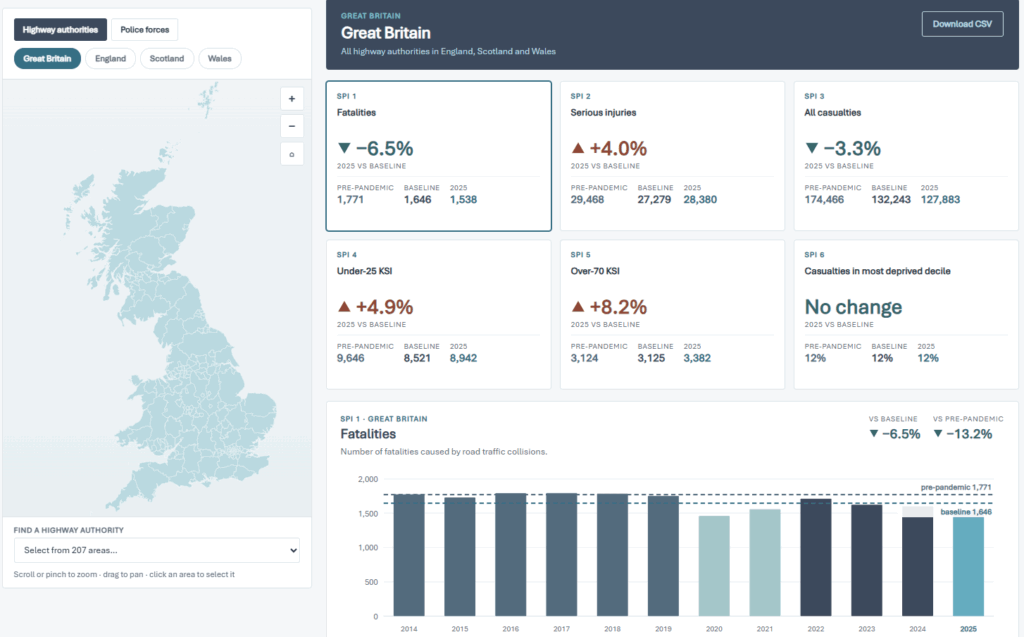
This paper sets out what an SPI is, why leading and lagging measures behave so differently, where the national framework still has room to grow, what can be measured today with new data sources, and how area-level reporting can be made statistically defensible — including new Agilysis analysis of all 207 highway authorities and 43 police force areas against the six national indicators currently reported at area level.
“Applying national indicators to individual authorities introduces a statistical problem that a simple percentage change cannot address.”
Agilysis analysis of 207 highway authorities & 43 police force areas, across the six national SPIs reported at area levelDefinition
A Safety Performance Indicator is a measurable proxy for road safety — a quantity tracked over time to judge whether a network, policy or intervention is moving in the intended direction.
Indicators sit between raw casualty statistics and the Safe System Components they’re meant to reflect, turning an objective as broad as “safer roads” into something an authority, police force or government can monitor and act on.
The logic is straightforward. Fewer deaths and serious injuries is the outcome everyone wants — but no team can manage directly for an outcome that only reveals itself three to five years later, once enough collisions have accumulated to interpret. Indicators give teams something to track in the interval: current signals of risk on the network, alongside the casualty counts that confirm whether that risk turned into harm.
This isn’t a new idea for the sector. Intermediate outcome measures were recommended alongside the 2020 casualty projections, but without a target attached they attracted little attention. Diagnostic work in 2023 found only 19% of organisations had indicators in place at organisational level — the appetite has long outpaced the infrastructure to act on it.
The core distinction
Every indicator falls on one side of a collision
The practical consequences of this split are considerable — it determines whether a team is managing risk, or just counting what risk has already cost.
Measured before harm occurs — speed, seatbelt use, mobile phone use, road star ratings
Measured after harm occurs — fatalities, serious injuries, casualties by group
Leading measures
Risk factors observed before they contribute to a collision. Proactive by design — no team needs to wait for a death to know a road has a speeding problem.
- Historically costly: roadside observers, ~12 DfT sites nationally
- Now affordable via AI detection and connected-vehicle data
- Only 3 of the 17 national indicators fall here
Lagging measures
Outcomes that have already happened. The most straightforward to produce, because DfT publishes STATS19 collision data annually.
- Fatalities, serious injuries, casualties by road user or age
- Accurate, but by definition arrive after someone is hurt
- 14 of the 17 national indicators fall here
KSI casualties rose 4% in 2025, to 29,918 — moving the baseline in the wrong direction at the very start of the target period. A 65% reduction by 2035, against a 2022–2024 baseline, requires sustained annual improvement the sector hasn’t recently achieved. Agilysis modelled just how challenging that trajectory is in a separate 2025 report, 65% in a Decade? — which is exactly why early, leading signals matter now.
The Road Safety Strategy
The first strategy to build SPIs into its core
Of the 17 indicators the strategy sets out, the large majority are lagging: fatalities, serious injuries, all casualties, and further breakdowns by road user group, age and risk factor. Three are leading measures — speed limit compliance, seatbelt use, and mobile phone use while driving.
That balance reflects where measurement is currently practical, not a lack of ambition. Lagging measures can be assembled almost entirely from data DfT already collects; leading measures depend on observational surveys, data partnerships and infrastructure that vary considerably between areas. The strategy is candid about this and identifies further indicators under development — covering post-crash response, vehicle compliance, and road infrastructure star ratings, with no further update on timing as of today.
Table 1 · Agilysis analysis of DfT (2026a)
Two of five Safe System Components have a leading indicator
The Safe System model divides road safety into five interacting Components. A balanced framework should offer visibility across all five — the published 17 currently reach two.
Safe roads
iRAP star ratings identified for future development
Safe speeds
Speed limit compliance, plus lagging speed-related collisions
Safe vehicles
MOT, tax, insurance & Euro NCAP identified for future development
Safe road users
Seatbelt & mobile phone use, plus lagging alcohol/drugs/distraction
Post-crash response
Time to medical care identified for future development
Most lagging measures sit awkwardly against this structure. A fatality or serious injury is the end result of a failure somewhere in the system, rather than evidence of failure within one specific Component — a structural feature of outcome measures generally, not a gap in this particular framework. In practice, that means treating the published 17 as a partial toolkit and supplementing it locally: roads, vehicles and post-crash response remain largely unmeasured at leading-indicator level, and the data to start doing so already exists in forms most authorities can access.
What can be measured now
Two developments close part of the gap already
Self-reported behaviour
ESRA — e-Survey of Road User Attitudes
A self-reported behaviour survey run across roughly 40 countries, with the next UK round funded by DfT. It covers around 400 items across speeding, alcohol, distraction, protective equipment and fatigue — captured by road user type. Results are reliable at national level only for now, but a future round is designed to support regional or local breakdowns — a realistic near-term gain rather than a distant aspiration.
Technology-enabled measurement
Detection at a scale no manual survey can match
Floating and connected-vehicle data generate speed compliance continuously across a whole network. AI detection assesses seatbelt and mobile phone use without an observer present, applied by Agilysis at national scale for the Asian Development Bank.
Detecting real change at area level
Publishing an indicator is the easy half
Road casualties are rare events, and rare-event counts behave in a specific way: the smaller the count, the noisier its year-on-year movement — regardless of what’s actually happening on the roads. Agilysis tested this across all 207 highway authorities and 43 police force areas, comparing 2025 against the 2022–2024 baseline for each of the six national indicators reported at area level. Try it below.
Try it: how many annual casualties before a change is real?
Drag the slider to change the annual casualty count for an area. Watch the confidence band around a genuine year-on-year change narrow as the count grows.
At 4 a year, even a fall to zero deaths sits at the margin of statistical significance.
- All-casualty counts support a genuine single-year comparison at both authority and force level.
- Fatality counts do not support a single-year comparison anywhere — at the median authority, even a fall to zero sits at the margin of significance.
- Sub-group indicators (casualties under 25 or over 70, deprivation-based measures) largely fail at authority level and are marginal even at force level.
- Real variation adds a second complication — weather, traffic volumes and recording changes move counts beyond chance alone. Once accounted for, the threshold for a genuinely detectable change rises to roughly 25–30% at authority level and 15% at force level, even for the all-casualty indicator.
Agilysis on Safety Performance Indicators
Working across the whole problem, not one part of it
SPI Analysis Dashboard
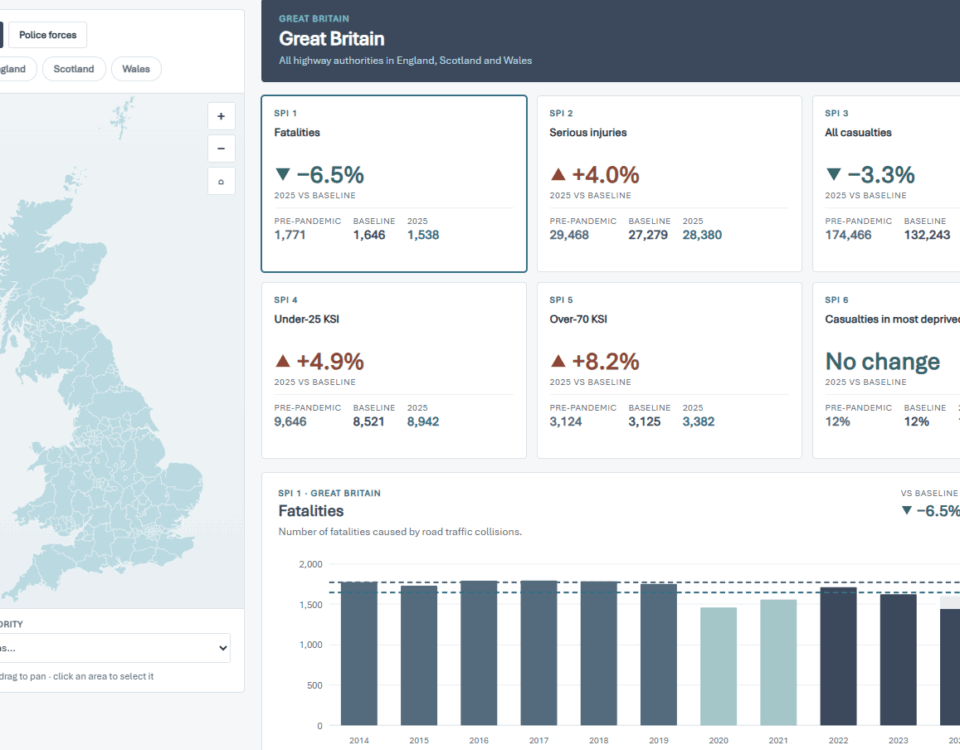
Extends the six national indicators reported at area level down to all 207 highway authorities and 43 police force areas. It doesn’t yet include the statistical treatment above — that’s planned, so users can see clearly what can and can’t be said reliably about an individual area.
Bespoke SPI frameworks
Tailored indicator sets for clients the national framework doesn’t fit — including a 19-indicator framework for Transport for Greater Manchester spanning infrastructure, enforcement, vehicle safety and active travel.
Speed Compliance Tool
Continuous, network-wide visibility of speed limit compliance without commissioning a new physical survey — down to individual roads or any defined network geography, over time.
Recommendations
Five steps for anyone reporting indicators locally
-
Treat the national 17 as a foundation, not a complete set
Build additional leading measures for uncovered Components from iRAP star ratings, vehicle licensing and insurance data, and ambulance response times.
-
Match the statistical method to the size of the count
Single-year comparisons work for high-count measures like all-casualty totals. For fatalities and small-number measures, use rolling multi-year averages.
-
Present area comparisons as ranges, not rankings
A rate ratio with a confidence interval, or a funnel plot, communicates real uncertainty that a league table conceals.
-
Confirm data continuity before acting on a flagged change
A sudden movement in recorded casualties is as likely to reflect a change in recording practice as a change on the roads.
-
Use technology to make leading measures affordable
Connected vehicle data, AI detection and crowdsourced sources deliver leading measures at a fraction of manual-survey cost, at a scale manual methods can’t reach.
Conclusion
A start, not a conclusion
Three of the five Safe System Components still have no leading measure, and area-level reporting needs more statistical care than a percentage change conveys. The means to address both are already available and already in use. Agilysis would welcome a conversation with any organisation working out how to report against the new indicators — or how to go further than the published 17.