How we measure road safety shapes how we improve it. In a recent episode of The T Junction podcast, Steve Ferris spoke with Richard Owen, and Nathan Harpham, about the growing role of Safety Performance Indicators (SPIs) in the new road safety strategy. Their discussion highlights a critical issue for road safety professionals: it’s not just about how many indicators we have, but what they actually tell us.
What Are Safety Performance Indicators?
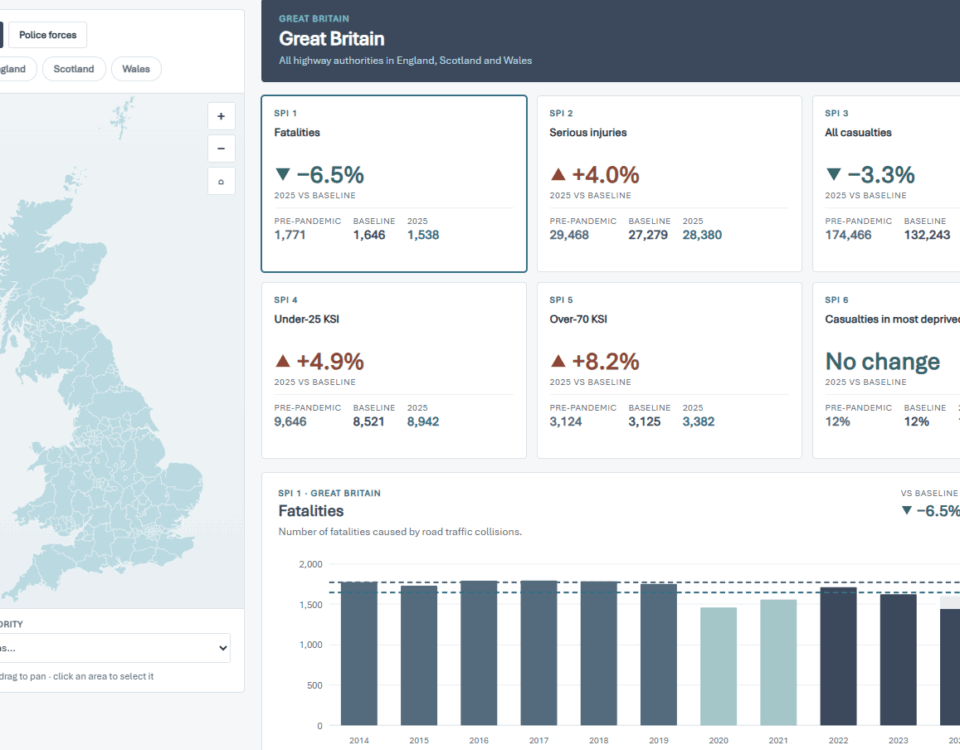
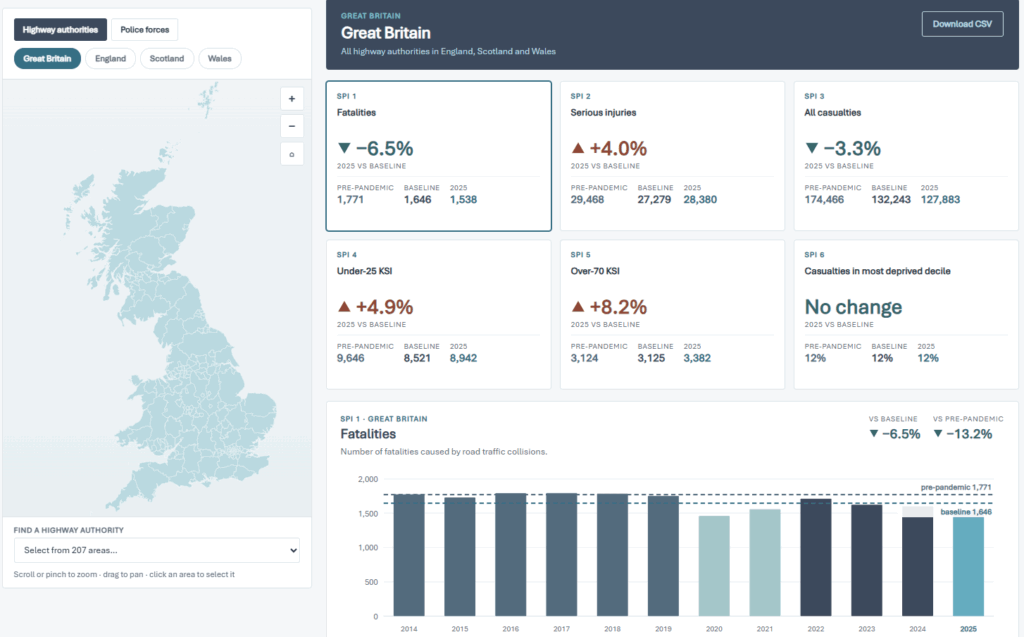
The current strategy includes seventeen SPIs, covering a mix of outcomes and behaviours. Many of these are lagging indicators, such as the number of people killed or seriously injured, often broken down by road user type or contributing factor. These measures are familiar, widely available, and relatively easy to report using existing datasets like STATS19.
However, lagging indicators only describe what has already happened. By the time the data is available, the harm has already occurred, often reflecting failures from years earlier.
Leading indicators focus on present‑day risk rather than past outcomes. They measure behaviours and conditions that are known to increase the likelihood of future collisions, such as speeding, seatbelt non‑use, mobile phone distraction, or poor road conditions.
The advantage of leading indicators is speed. Unlike casualty data, which may require 3 to 5 years to be meaningful, leading indicators can be collected quickly and used to identify emerging risks in near real time. This enables earlier intervention and more targeted action.
The Practical Challenges of Measuring Risk
Collecting leading indicator data is more demanding. While national bodies can run roadside surveys, replicating this locally can be expensive and resource‑intensive. Traditional observation methods, such as monitoring seatbelt or mobile phone use, are effective but not always practical for local authorities.
That said, technology is changing what is possible. AI‑based systems can now detect behaviours inside vehicles, such as seatbelt use or mobile phone distraction. While often used for enforcement, these tools also provide valuable insights into network‑wide risk levels.
Leading indicators do not require perfect data to be useful. What matters is having a large enough and representative sample across different road user groups, locations, times of day, and demographics.
Importantly, leading indicators allow faster feedback. Instead of waiting for annual casualty statistics, authorities can identify problems sooner and adjust interventions accordingly.
Do the Current SPIs Cover the Whole Safe System?
While the seventeen SPIs in the road safety strategy are a strong starting point, they do not yet cover all Safe System components equally. Most indicators focus on outcomes and road user behaviour, with fewer measures relating to vehicles, infrastructure, or post‑crash care.
The strategy does, however, signal future development. Potential indicators include vehicle safety standards, road quality measures such as iRAP ratings, and post‑crash response times—suggesting a more balanced framework could emerge over time.
An opportunity for a wide collection of leading indicator data is ESRA (the eSurvey of Road User Attitudes), which the Department for Transport already funds. ESRA captures self‑reported behaviours such as speeding, impairment, distraction, fatigue, and use of protective systems across multiple countries.
Although ESRA currently operates at a national level, it offers valuable insight into behavioural risk and trend tracking, highlighting opportunities for future expansion or local alignment.
SPIs are not just a reporting exercise. Used well, they help road authorities move from reacting to harm towards managing risk proactively. To meet ambitious road safety targets, relying solely on casualty data is no longer enough.