How does your local road safety performance actually compare to the government's new targets? Until now, answering that meant digging through a national STATS19 spreadsheet and working it out yourself. Agilysis has changed that.
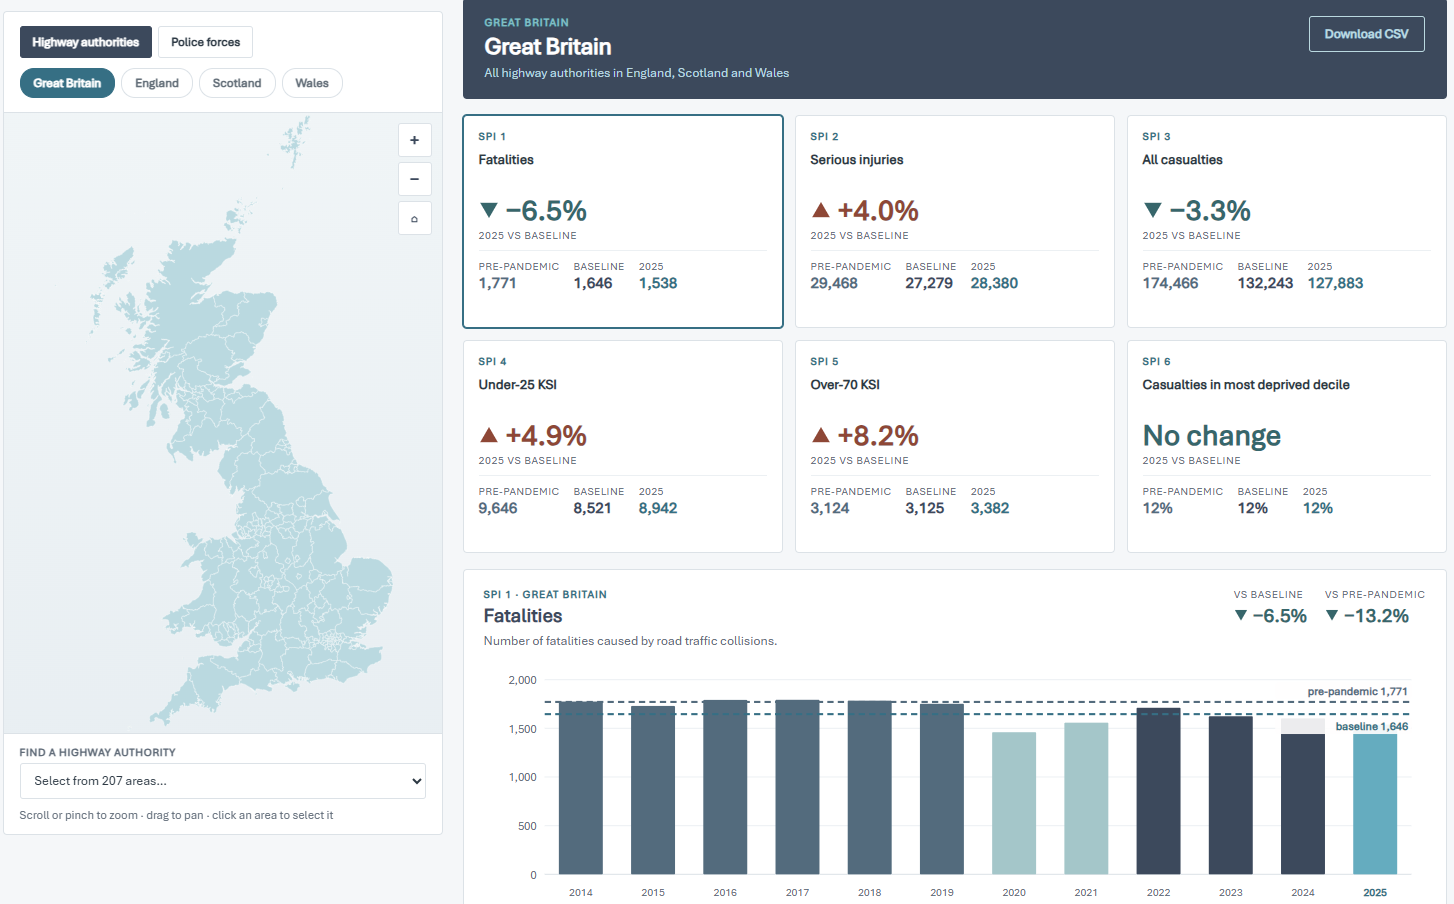
Just two weeks after the Department for Transport (DfT) published the final 2025 Reported Road Casualties Great Britain (RRCGB) data, Agilysis has launched a free, interactive Road Safety SPI dashboard giving every highway authority, police force and Nation in Great Britain its first look at performance against the baseline set in the government's Road Safety Strategy.
What's in the dashboard?
The dashboard covers Great Britain, England, Scotland and Wales, and all 207 highway authorities and 43 police force areas, across six of the 17 national Safety Performance Indicators (SPIs) set out in the Department for Transport's strategy, published earlier this year. That strategy sets targets measured against a 2022 to 2024 baseline.
SPIs are measurable proxies for road safety, tracked over time to judge whether a network, policy or intervention is moving in the right direction. Some are lagging indicators, describing outcomes that have already happened, such as fatalities and serious injuries. Others are leading indicators, describing risk factors before they contribute to a collision, such as speed compliance, seatbelt use and mobile phone use, giving an earlier signal than waiting for a casualty count.
In the dashboard, you can see your area against three reference points at once: the 2014 to 2019 pre-pandemic average, the DfT's official 2022 to 2024 baseline, and the new 2025 year. This means that there’s context alongside each SPI rather than a single misleading statistic.
Why does one year of data need three years of context?
A single year of casualty data, particularly for smaller counts, will always fluctuate more than the network's underlying safety actually does. That's why every figure isn’t presented in isolation but is shown alongside the longer pre-pandemic average and the baseline figures.
Statistical significance testing is planned for a future update, to help flag which year-on-year movements in an area's figures are likely to reflect a genuine change rather than ordinary fluctuation. Agilysis' companion in-depth article, Measuring risk before it becomes harm, sets out that distinction in more detail.
What about authorities going through reorganisation?
Several highway authorities are well into Local Government Reorganisation, with some having new unitary boundaries proposed but not yet confirmed by government. Agilysis has deliberately built the current version on 2025 boundaries, the most recent confirmed geography, rather than estimating ahead of a decision that hasn't been made yet.
A future update is planned once boundaries are confirmed, so that newly formed unitary authorities can see what their combined area SPIs already look like under the same baseline, rather than starting their reporting from zero on day one.
"This is the first year we can actually measure locally against the targets in the new strategy, so it's important that we get an accurate measure," said Richard Owen, CEO at Agilysis. "The only complication is LGR, but once that is settled, we'll include new authorities in an update later this year. We built this dashboard to make data more accessible to those who run our road networks, making it free and in one place, rather than leaving it buried in a national spreadsheet."
What's next for the dashboard?
Six of the 17 national SPIs are live now. The remaining 11 will be added as the DfT grants approval; several of them, including the proportion of traffic travelling within the speed limit, are already in progress and are waiting simply for data-sharing permissions.
The Road Safety Performance Indicators dashboard is free to use and is now available. If your authority or force wants to see how it's performing against the government's targets, or has thoughts on what would make the dashboard more useful, get in touch.

CEO
Richard Owen

Consultant