PACTS / Direct Line Constituency Road Safety Dashboard
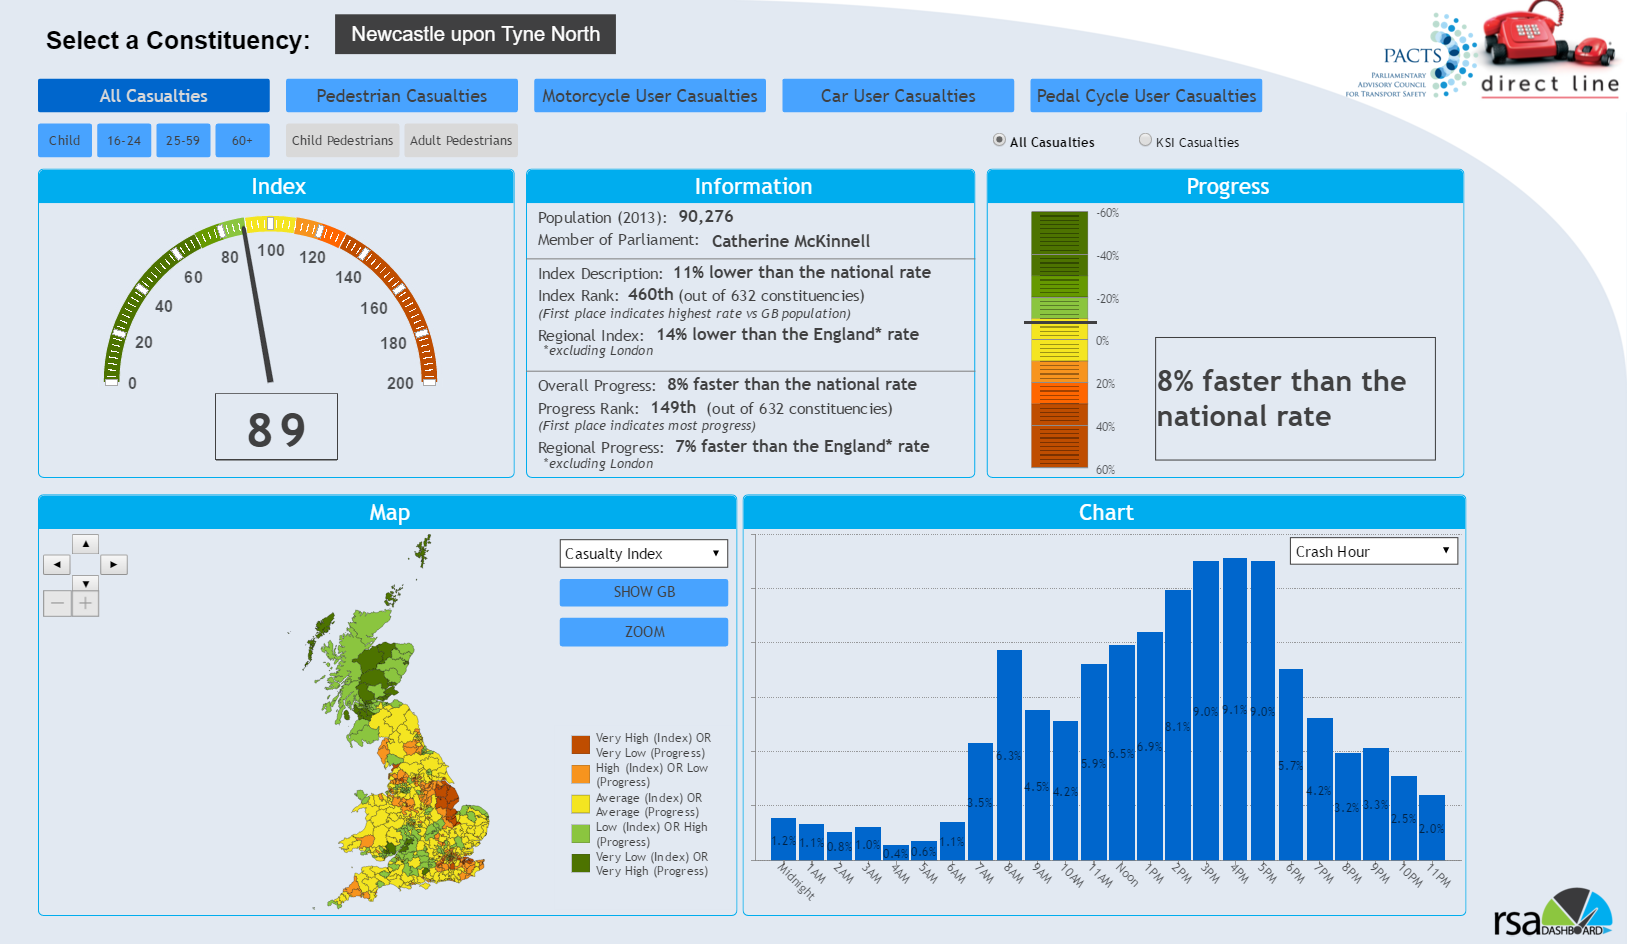
The Parliamentary Constituency Road Safety Dashboard published by PACTS and the Direct Line Group, reveals how the casualty rate (by population) varies across the parliamentary constituencies in Great Britain. Using information from the Department for Transport STATS19 statistics between 2009 and 2014, the Dashboard presents information on casualties for residents of the constituency, rather than looking only at collision locations. The Dashboard also provides an analysis of progress over the last six years, comparing each constituency against the national average.
Separate analyses are provided by casualty severity, major road user casualty groups (pedestrians, pedal cyclists, motorcyclists and car users) and by age groups.
The purpose of the Dashboard is to provide additional specific local information to stimulate action to improve road safety for all road users.
Browsing time
180seconds
per visitor
Price
£Bespoke
- ContactUs
How we succeded
1Technology
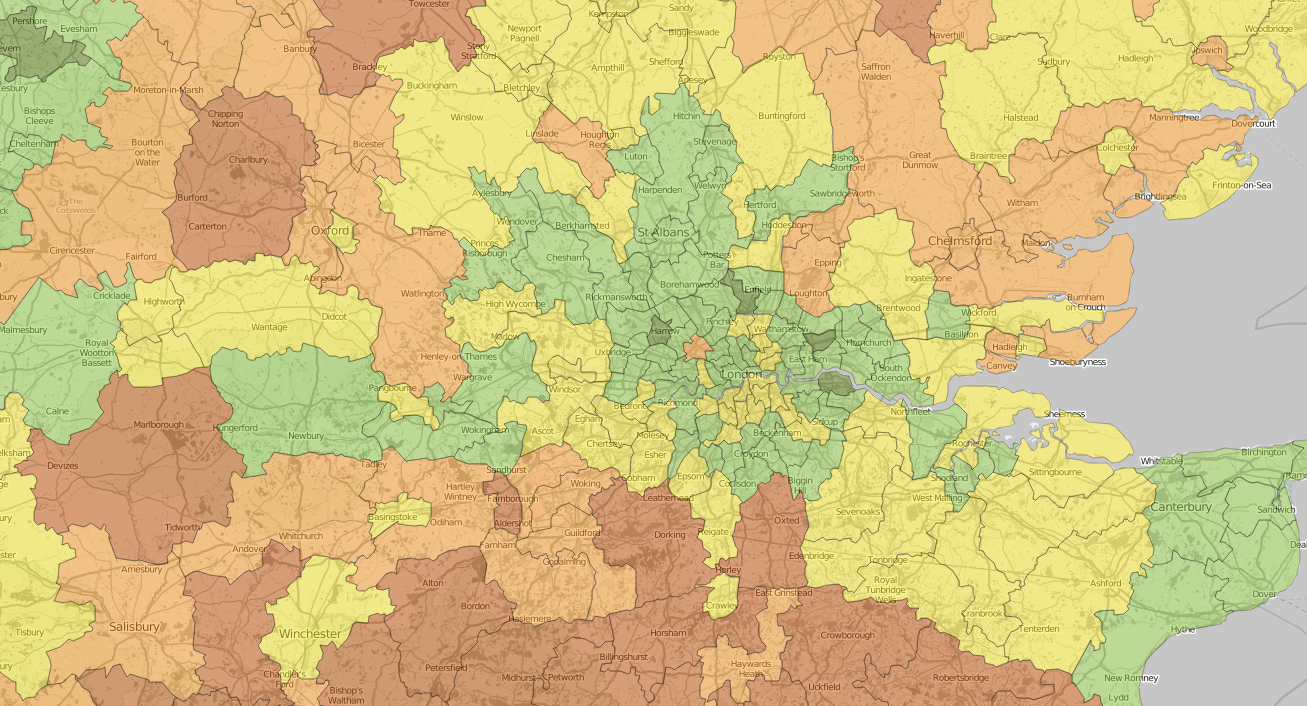
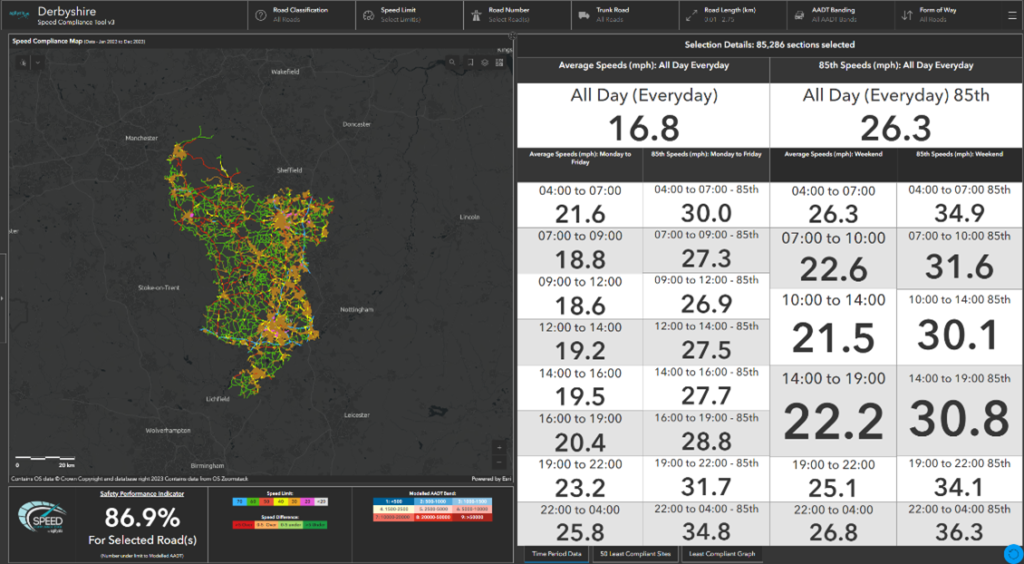
We have continually invested in new technology to enable us to better visualise large and complex datasets. Here we used a combination of a data dashboard embedded within the clients website with bespoke maps hosted on our dedicated Geographic Information System (GIS) server. All of the data was open-access with website traffic balanced using our Amazon AWS server infrastructure.
2Subject Expertise
Rather than simply analysing where collisions happen, we used our knowledge and experience to match constituents populations to local residents involved in crashes anywhere in the country. This allowed us to create indexes reflecting the likelihood of being a casualty versus national and regional averages.
3Open Data
Our commitment to data transparency involved publishing our methodology as well as the results in a format that can be re-used by third parties such as local authorities, the press, and the public.
4Engaging story
We understand how to make data accessible to the public as well as professionals and the colour-coded gauges provided instant feedback on local performance in areas such as pedestrian and motorcycle safety. We were on-hand to assist the clients on the day of release and also facilitated a workshop with parliamentary researchers.
Project Manager

Richard Owen
Operations Director
To accompany the online dashboard we produced a report for MPs and road safety professionals that covered the following areas of interest
Data sourcesMethodologyNational trendsBest performing constituenciesRegional comparisons
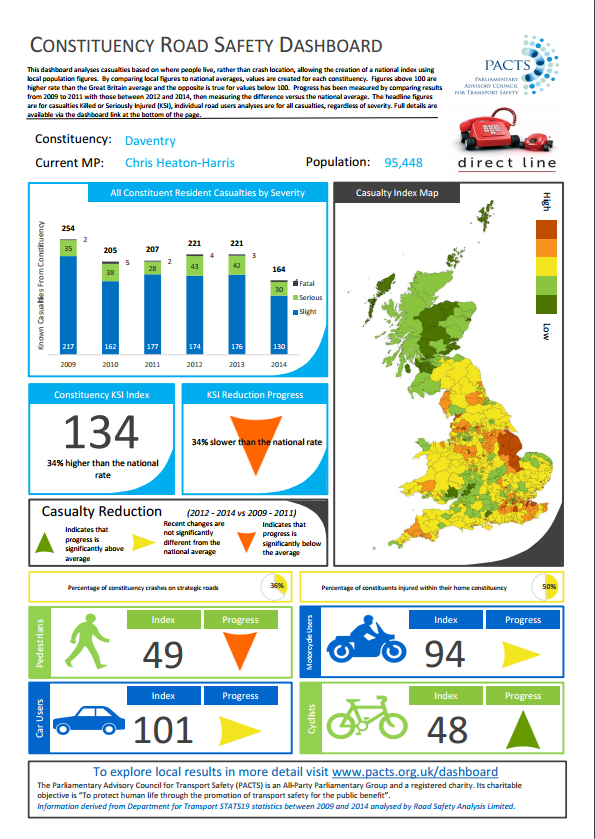
As well as providing the online dashboard, MPd and constituents can search for their area and download a quick factsheet featuring the following
Annual progressRegional comparisonsRelative changePedestriansMotorcyclistsCyclistsCar occupants


