Reviewing the 2019 Road Casualty Statistics
A blog by our CEO, Richard Owen
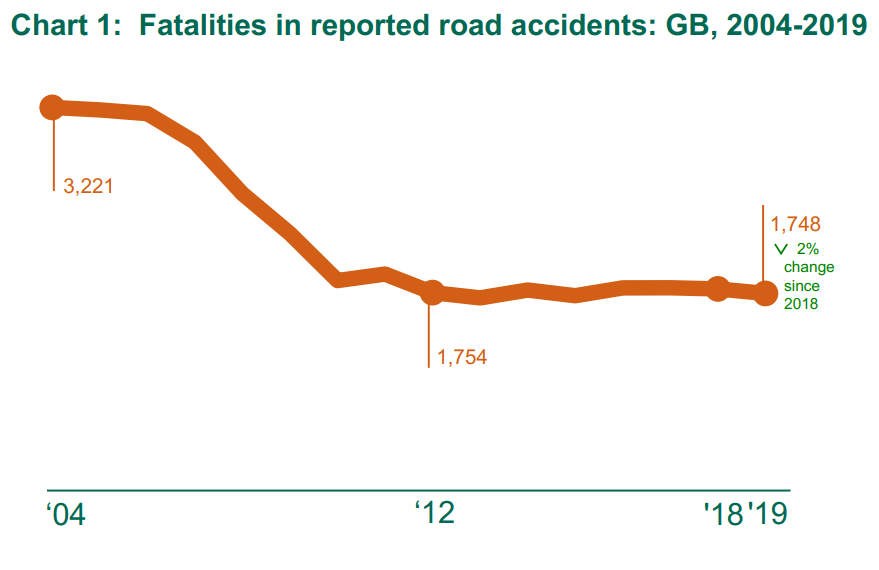
The DfT Stats Team have released the 2019 Recorded Road Casualties Great Britain report and supporting tables. The headline stats were trailed in July with the release of the provisional results so we knew that, once again, there would be no significant change to the flatlining trend in fatal casualties over the last eight years. It’s also quite difficult to draw any significant conclusions by looking at a single-year change from 2018 to 2019.
The 2019 results show very little change compared to 2018, or indeed much of the previous eight years, which means continuing inequality in road risk for vulnerable road users compared to vehicle occupants.
As is now the format, the report itself is a summary PDF with simplified charts and tables, together with notes on any changes to the statistics and collection methodologies. There are a whole host of zipped XLS files for those that want to review more detailed statistics, or you can use the self-serve customised table download option.
It’s interesting to note that there is no attempt to assess the statistical significance of any change, as has sometimes been seen previously (see Reported road casualties in Great Britain: provisional estimates year ending June 2019 pg.3).
It’s interesting to note that there is no attempt to assess the statistical significance of any change, as has sometimes been seen previously (see Reported road casualties in Great Britain: provisional estimates year ending June 2019 pg.3).
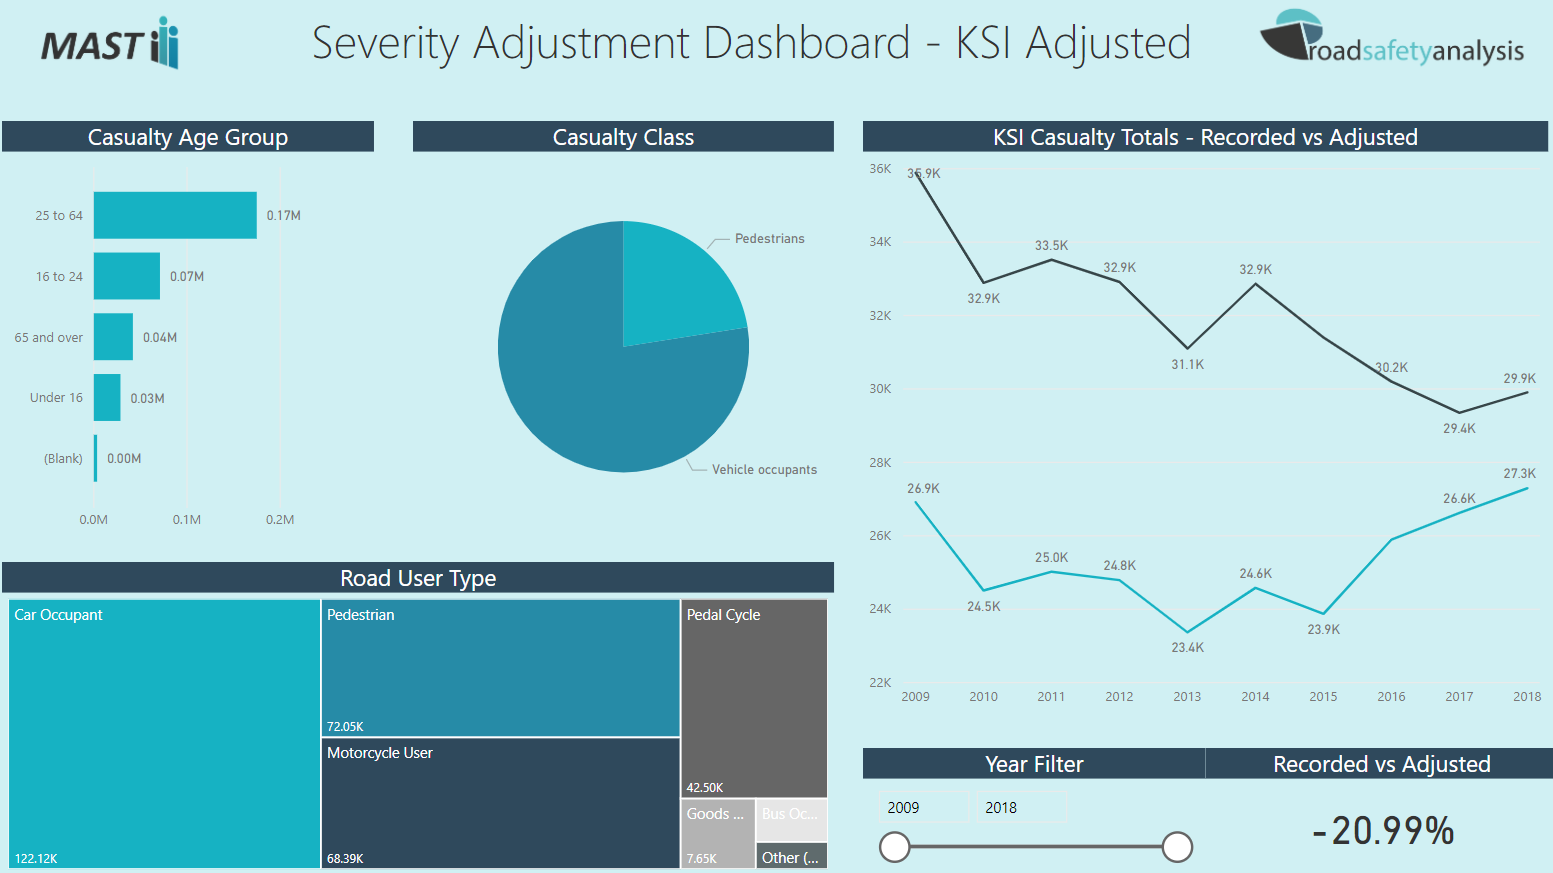
In the published files, it is worth mentioning that there are now two versions of results: one for unadjusted figures (serious and slight) and another for the adjusted results. We won’t go into detail on the adjustment methodology here as that has been covered before by the DfT in last year’s report, and we looked at it in a previous blog too. It is worth noting however that they have updated the methodology and say that, “over the next few years we expect to update the model further, as more forces move to an injury based reporting system”. This means that previous adjusted totals now need to be recalculated using the lookup tables provided on www.data.gov.uk . We will of course be changing the figures in our online dashboards as well as MAST Online.
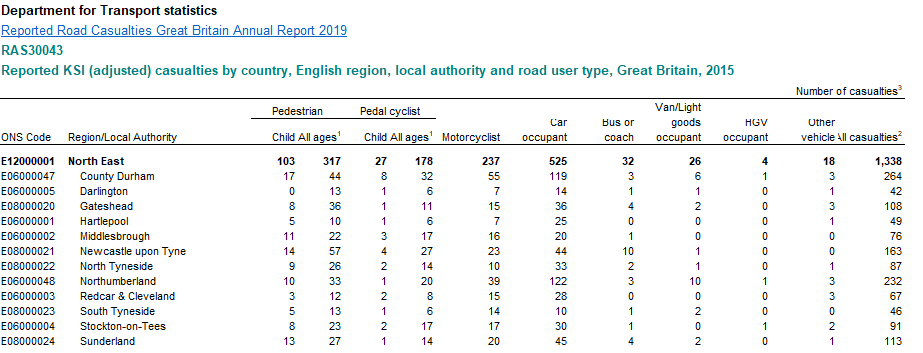
The severity adjustments are not recommended for use with small sample sizes, even though estimates are provided for each individual casualty. The DfT say that, “for users wishing to look at low level geographic data just for the latest year, you are advised to use the unadjusted data from the open data”. It’s not clear what a ‘low level’ is in terms of geographic area but as the DfT publish adjusted severities for highway authorities it should be assumed that this implies figures for individual roads and route, plus small-area geographies, such as super output areas.
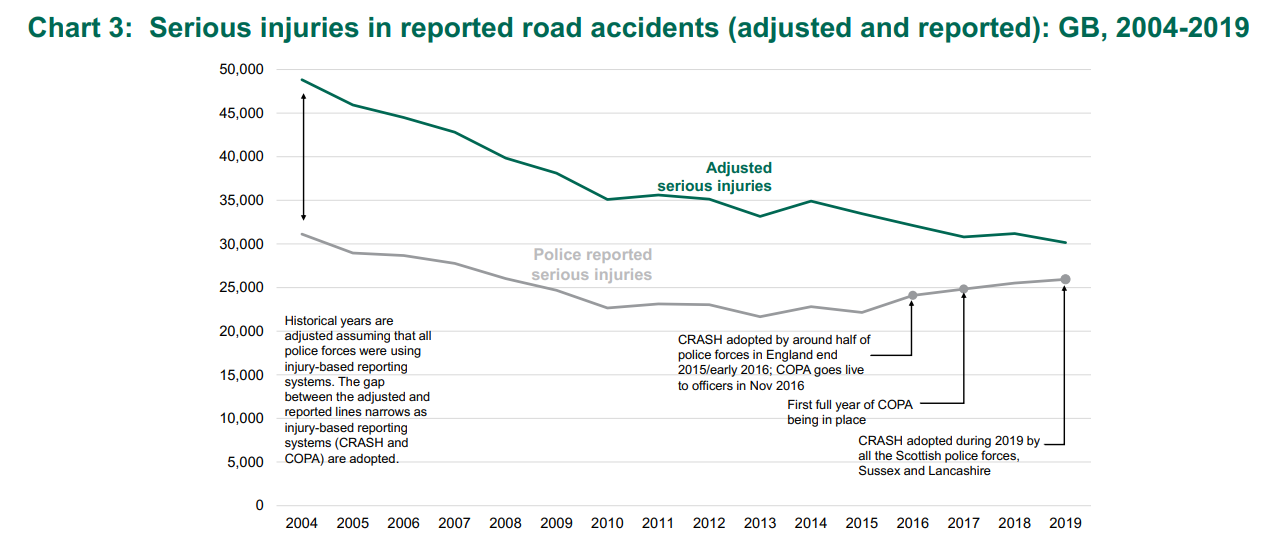
Figure 3 in the report shows how the lines for reported and adjusted serious injuries are beginning to converge as more forces switch to an injury based reporting system (IBRS). The adjusted figure is declining year on year, unlike the fatal figures. The number of slight injuries reported has also dropped again, continuing the trend seen over the last decade. The change in KSI casualties over the last 8 years is arguably the most important number as we were still seeing big falls between 2009 and 2011 and these aren’t separated out in the report itself.
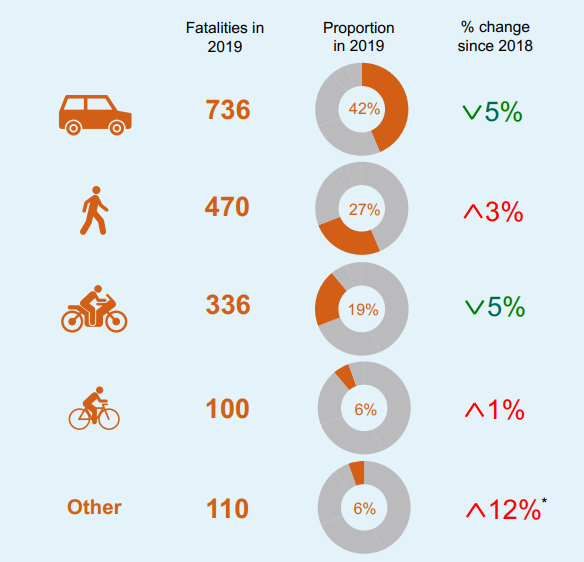
The proportion of fatalities that are vulnerable road users (pedestrians, cyclists and motorcyclists – a figure for horse riders is not included) remains largely static, mainly due to a 5% drop in motorcycle fatalities. Number for pedestrians increased very slightly, cyclist fatalities saw no significant change. This way of reporting deaths doesn’t take into account conflicting vehicles however. It is arguable that understanding which vehicles are injuring VRUs is just as important as knowing how many casualties there were. We hope to have an announcement on an interesting new methodology on this very soon.
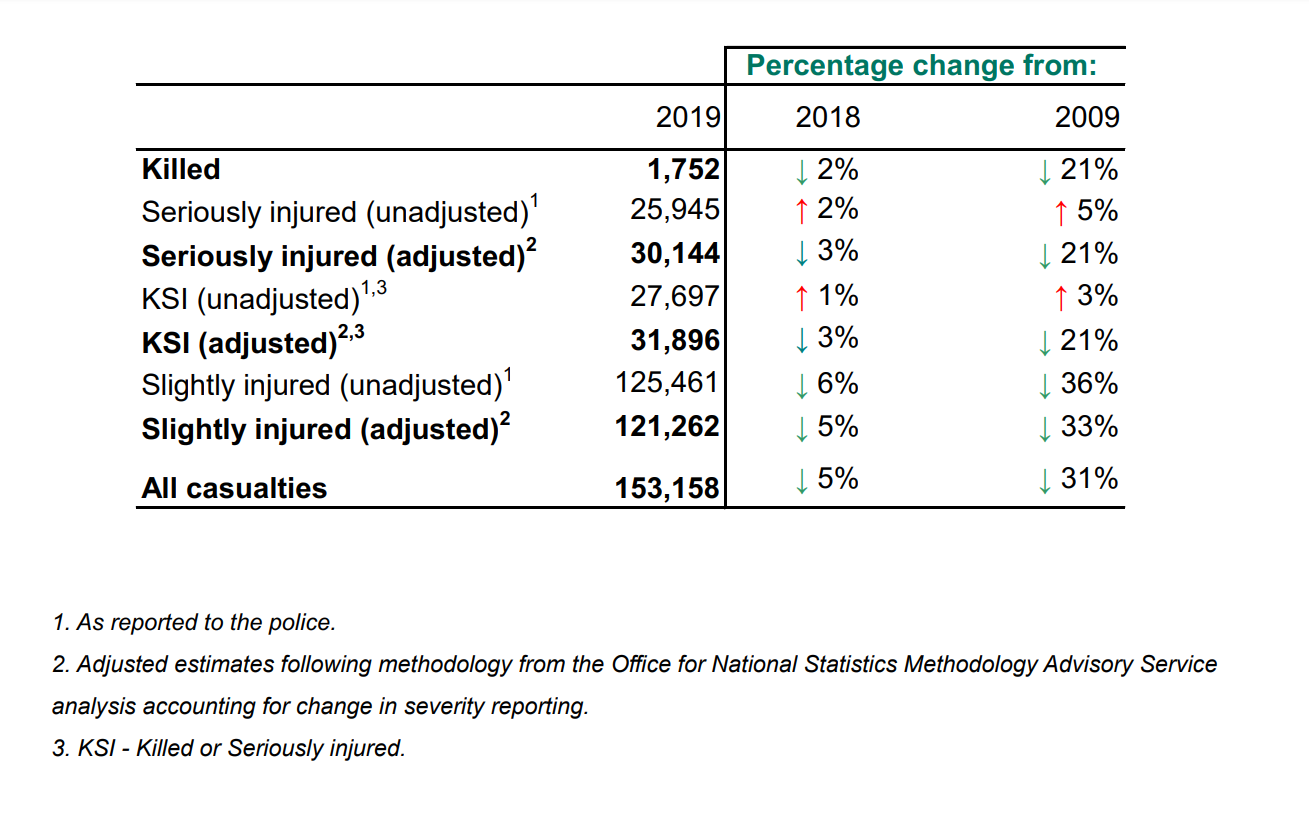
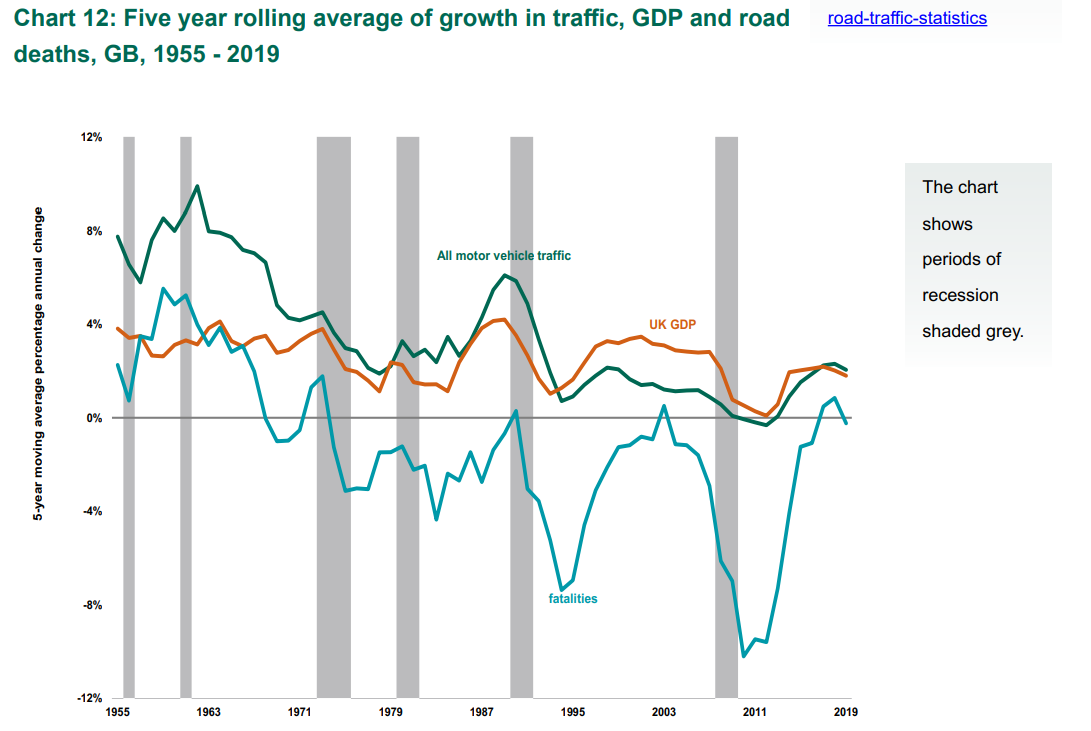
Just looking at raw numbers is not a reliable measure of road danger relative to population, or vehicle miles driven, which is why figures are produced each year to show if the casualty rate is changing. Fatalities per billion vehicle miles is declining slightly, unlike the raw casualty number. This reduction is larger for KSI casualties and all casualties. Traffic has increased by 16.6% since 2010 so objectively, road travel has become safer. For all casualties since 2009 the quoted figure is a 40% decrease. The majority of these ‘savings’ have been for vehicle occupants, however, which shows increasing levels of inequality on our roads.
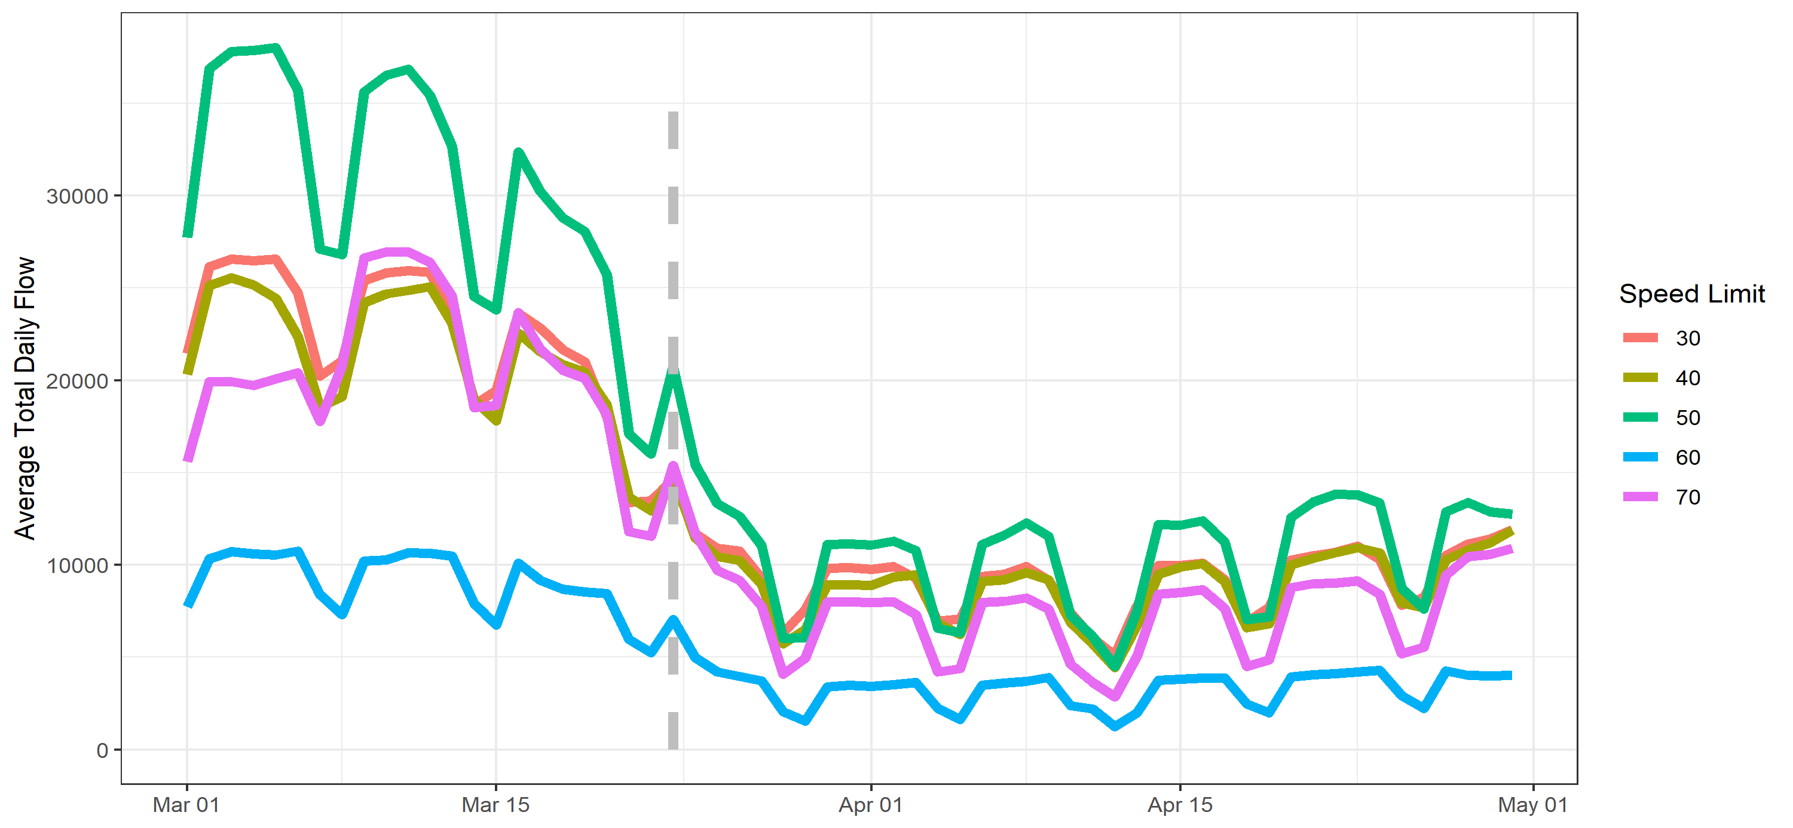
Of course, when we look at data from 2020 next year, we are going to see something very, very different. The unprecedented drop in vehicle traffic from mid-March has led to a reduction in recorded injuries but questions have been raised about whether the reductions mirror traffic flow, or whether the injury rate might actually have increased. Increased vehicles speeds in lockdown would be expected to result in an increase in collision severity but it’s too soon to tell this from the GB data. Other countries such as The Netherlands already have evidence of this on their roads. The 2020 data is therefore likely to represent a break in the series making meaningful comparisons with 2019 almost impossible. We believe there are methodologies available to explore what’s happened in this unprecedented year and will welcome the publication of the provisional data for January - June 2020 later on this year.
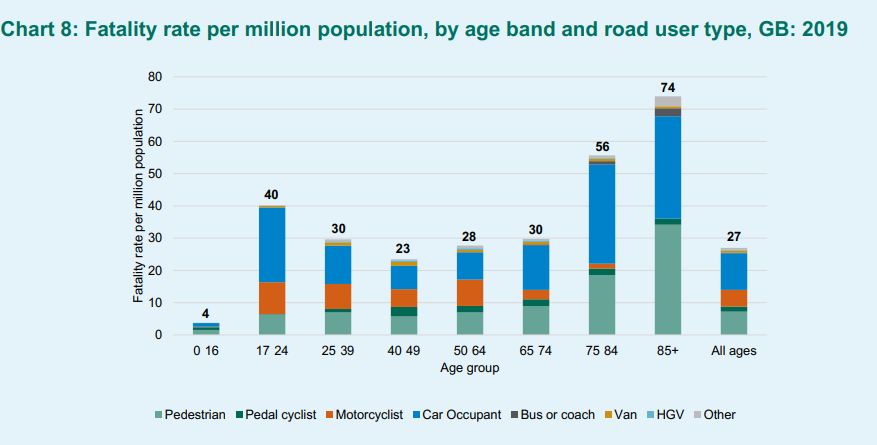
The final topic we are addressing now is changes by age group. The drop in young driver casualties has been significant over the last 10 years, largely due to reduced exposure (fewer young people driving). The increase in older driver casualties has been due to the opposite effect with more older drivers using the roads as a proportion of miles driven. Typically risk for age groups has been expressed by population, as seen in Chart 8 which shows the fatality rate per million population for set age bands. In this chart it makes it look like it’s those over the age of 75 that are at highest risk. Some have suggested that this is due to declining health impacting on driver performance, but more likely that it is to do with fragility and survivability, not that those in this group are involved in more crashes. A quick look at the casualty type breakdown very quickly shows that it is a rise in pedestrian casualties that is behind much of this increase, however.
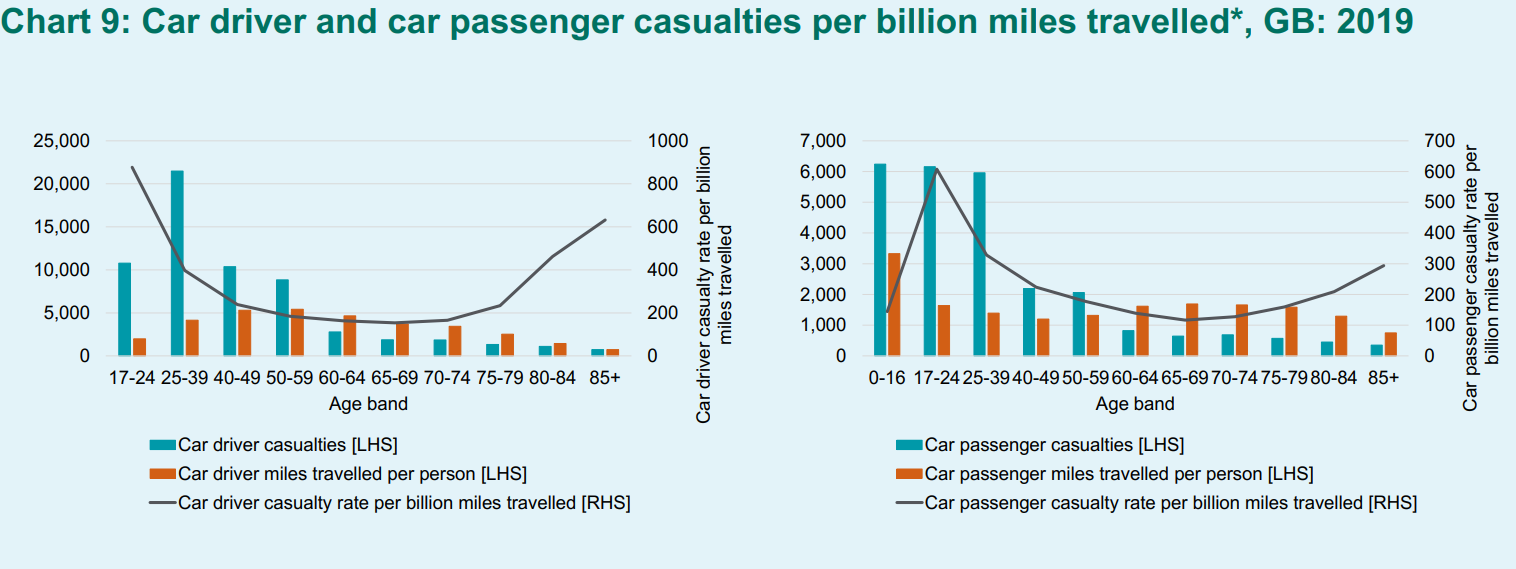
A more accurate way of assessing risk is to compare miles driven, a true exposure measurement. The only data available for this from the National Transport Survey which is a sample of the UK population based on surveys, rather than something more comprehensive based on vehicle tracking. Looking at Chart 9 we can see a different risk pattern, with young drivers showing a much higher casualty rate than even those in the 85 and over category. Here we see that the risk rate only really goes up when a driver is over the age of 80, and even then, it’s not too much higher than drivers in the 25-39 age band. It cannot be denied however that fatality numbers in this group are increasing and should therefore be given significant attention. Once again, this is an area where we are involved in carrying out research to understand what methods may be available to help reduce risk for older drivers.
Road safety is often measured, monitored and compared by looking at decades individually, even though the changes in year are largely arbitrary. Decade changes do often result in changes in policy including new targets but this has neot been the case in much of Great Britain since 2010. Officially, 2020 is the final year of this decade so we can’t say we have reached the end of this 10-year period, but this has been an epoch which has seen a stagnation in road casualties, and significant changes in how data is collected. With COVID-19 however the 2020 data is not going to provide any greater understanding of the decade as a whole but we can hope that the shock of the pandemic may lead to significant changes in the number of road casualties, and perhaps a new view on how vulnerable road users are prioritised.


