2019 Road Safety Data Now Available
As usual at this time of year we have been working hard to process the 2019 STATS19 and associated datasets which are now available in many of our tools and solutions. Please read on for details of where updates have taken place, how you can access the information and an online Q&A session planned with MAST Product Manager, Bruce Walton.
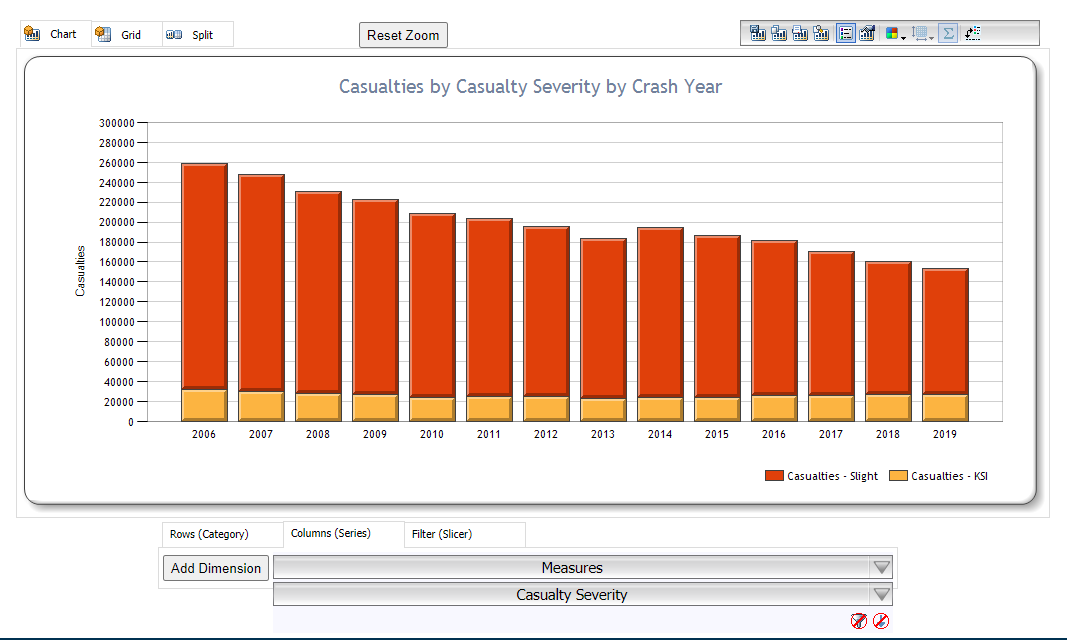
This is the eleventh time we have carried out an annual update of the data in MAST, and although the data was received much later in the year than previously, we are proud to have turned around the update in record time (12 days). The main MAST ‘instance’ has now been updated to include:
Collision records between 2006 – 2019 (as requested by the recent MAST User Group)
Experian MOSIAC population and socio-demographic classifications (matched at postcode level)
As a part of this year’s update we have carried out a full update of collision location matching, together with casualty and driver home. In the past our updates have been incremental (adding data on top of the previous year) but this time we have taken the opportunity to incorporate any corrections and adjustments made by the DfT in the intervening years.
Further updates will roll out over the rest of the month to include:
MAST Professional – This is the system used by approved organisations to review sensitive datasets including contributory factors, which will also receive an update back to 2006.
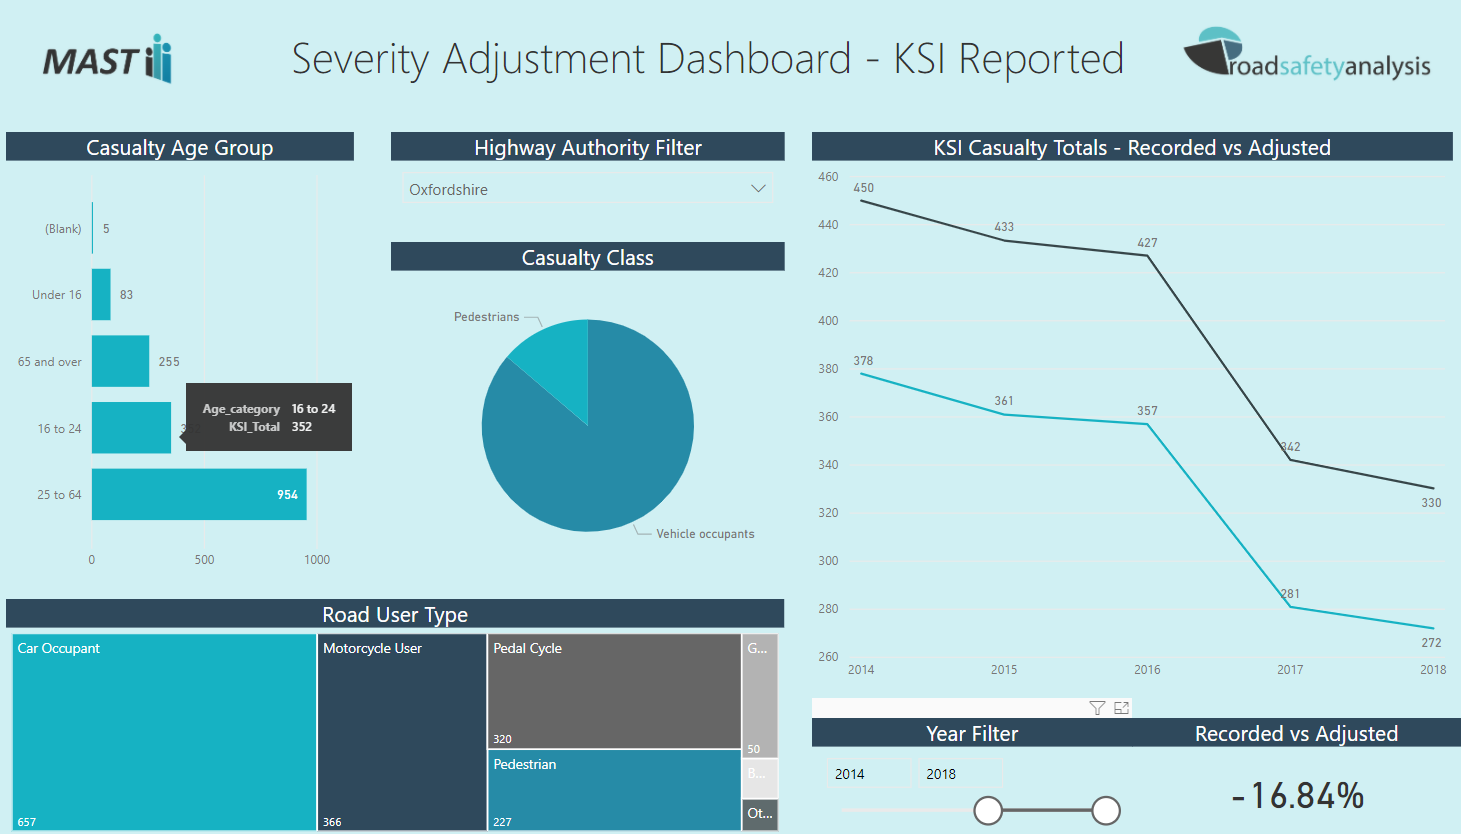
MAST DataMods and associated Severity Adjustment Dashboard – We introduced this last year and it has proved to be very popular with authorities wanting to explore the DfT / ONS methodology for adjusting serious and slight casualties in their area. This is essential for anyone who wants to understand the real trends in their areas and compare changes against national or regional averages.
MAST Scotland – We expect to receive this data very soon which allows us to update the Scottish dataset which does vary from the end-of-year totals published for Great Britain.
It is worth noting that although we have in the past matched collisions to the Highways England network, we adopted a new approach a few years ago to wait for the official figures from Highways England themselves. This often takes several months as individual collision locations are verified and we expect the matching of 2019 collisions to the SRN to be an update early in 2021. In the meantime you can of course use the road number data as a filter, and matching from previous years is still available.
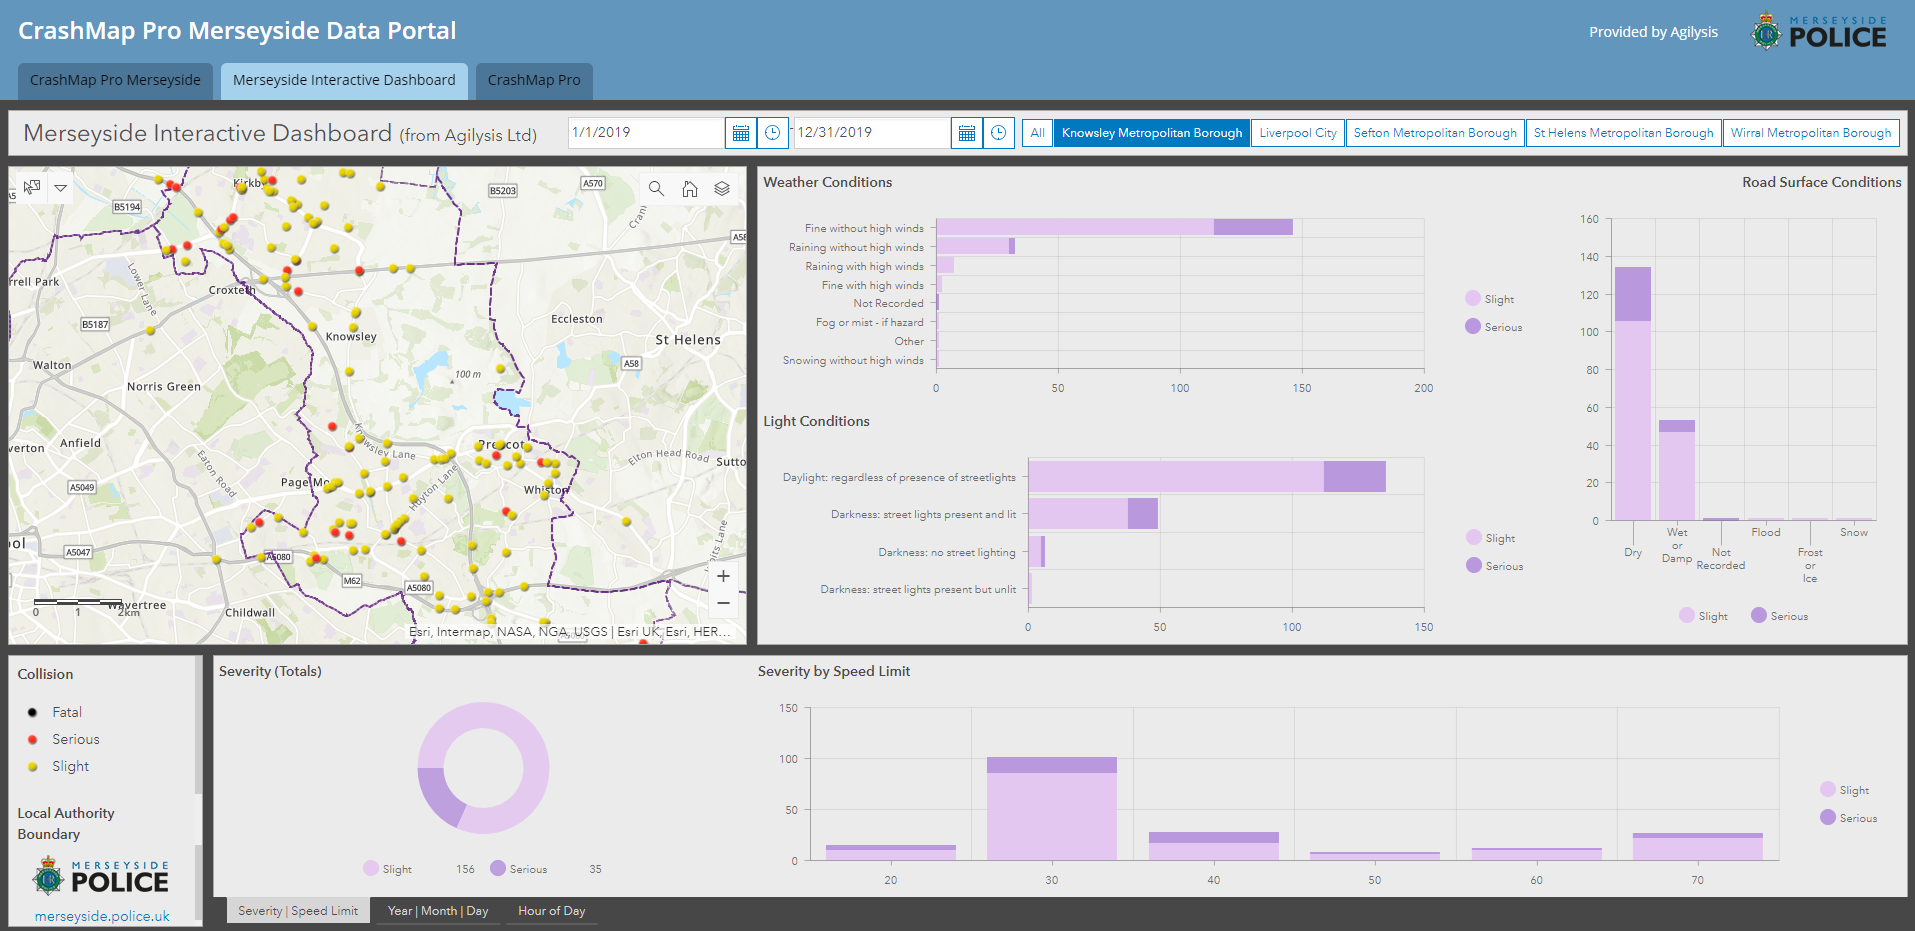
Although we included 2019 provision data in CrashMap and CrashMap Pro earlier in the year, we have now been able to include all 2019 data in the update that went live this morning. There are no significant changes to either of the two solutions as a part of the update, although we have taken the opportunity to improve collision matching accuracy in one area following feedback from a local authority. In this case significant work was undertaken to improve plotting accuracy from the original police records and these adjustments have not previously made it into the published DfT data. We were grateful to received new collision coordinates from the authority which will improve the system for all users. If you would like to discuss this in any detail, please contact Lyndsey who can explain the process.
Authorities and police forces that subscribe to their own private CrashMap Pro portal with quarterly updates are not affected by the data update as this works on a separate, bespoke dataset. Again, if you are an authority that would like to learn more about cloud-based collision analysis please do get in touch.
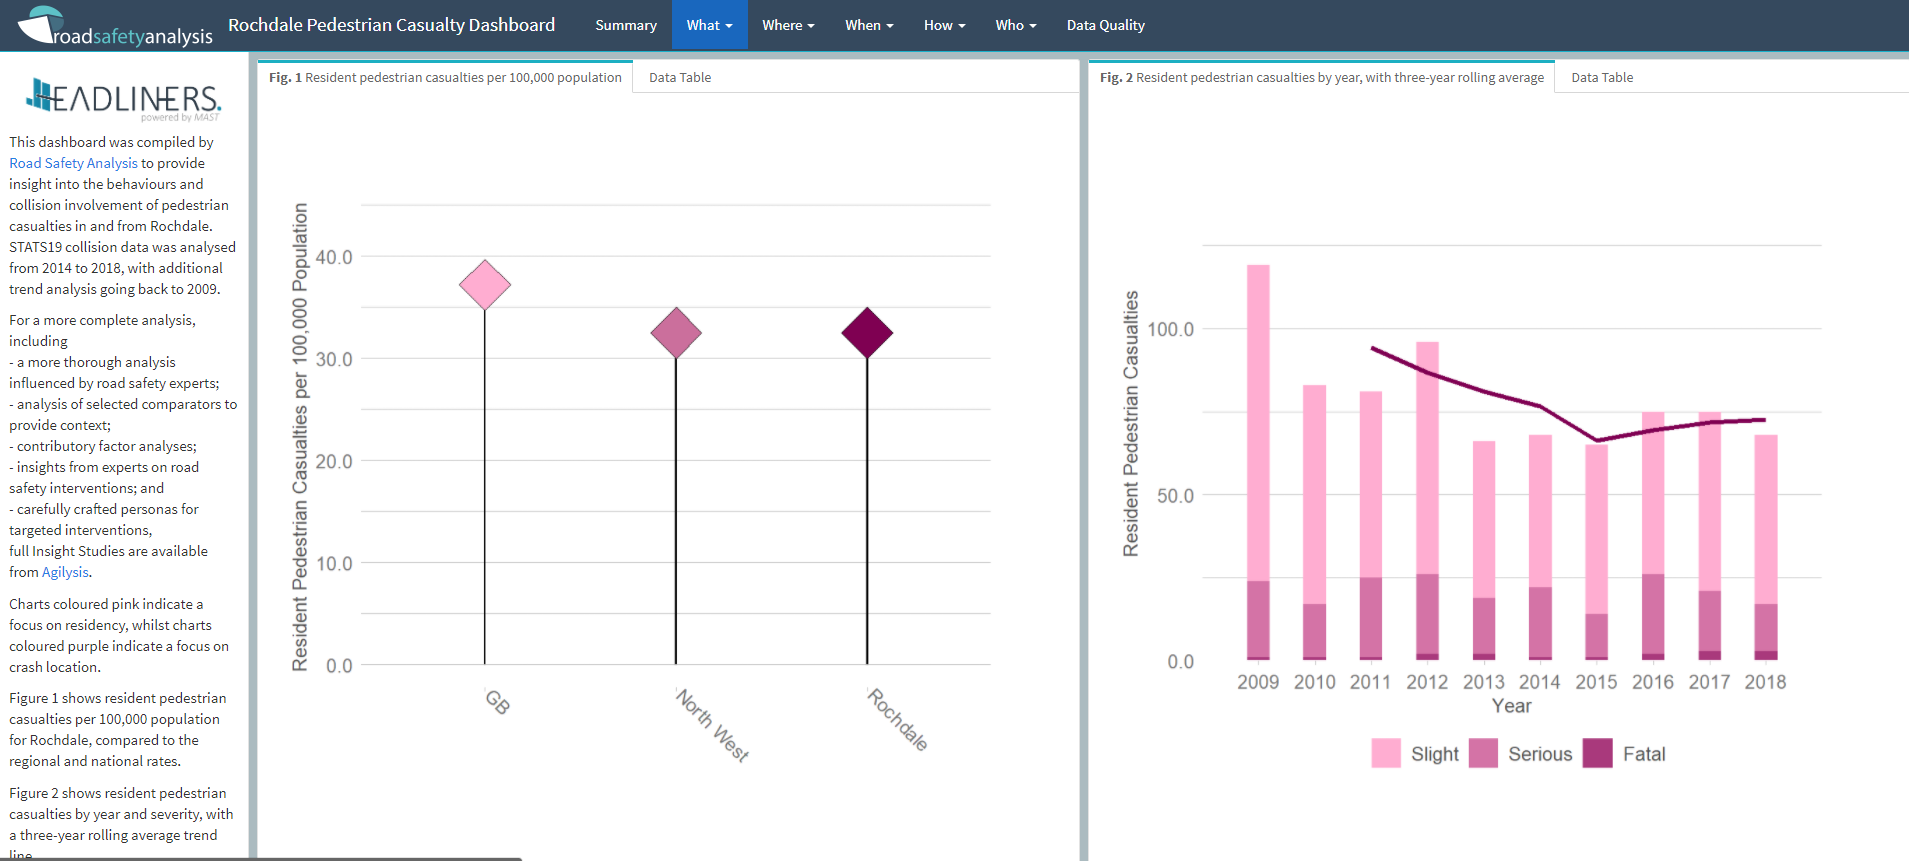
Over the years we have included various dashboards and maps for MAST users to help them quickly analyse common road safety issues without needing to setup individual MAST reports. These now include the regional PowerBi dashboards as well as local Headliners. The 1,230 individual Headliners are produced by our Analytics Team and focus on key road safety user groups such as motorcyclists or older drivers. As well as showing aggregated data, injury rates, and common contributory factors, the Headliners include collision heat maps for the selected road user groups.
Both the dashboards and Headliners will be updated by the end of the month and we will be in touch again soon to let you know when these are live.
Both the dashboards and Headliners will be updated by the end of the month and we will be in touch again soon to let you know when these are live.
In April we ran a successful Zoom call with MAST users which gave them the opportunity to ask questions about MAST functionality and specific scenarios. We are pleased to announce that on Thursday 22nd October we will be one again running a MAST User Group session and you are welcome to register and attend.
https://us02web.zoom.us/meeting/register/tZUkde6ppzspHNFB6Z93othdxnuzU2e8fN4V
This is of course in addition to our online support resources https://roadsafetyanalysis.org/support/ which includes the MAST Wiki, Bitesize Training Videos and MAST Curriculum which includes CPD certification. As ever, we are always here to support users or potential users with support requests.
If you are unsure if your organisation is already a MAST member, just drop us a line.


