Rural Speeds
So, how effective is reducing speed limits on rural roads?
Well, it depends! (There was no point in writing a blog post if it was straightforward).
We’ve got some answers from a first phase of a study for Surrey County Council, funded by the Road Safety Trust, and we will be completing Phase 2 later this year.
Here, we’d like to share some of the findings from that initial work. A full version of the phase 1 report can be found here.
Why do this project?
Firstly, we know that rural roads present greater risk than many other road types, with a much higher proportion of fatal and serious collisions occurring on rural roads than would be expected, based on traffic levels. Any research to support highways authorities with interventions to reduce risk is beneficial.
Secondly, Surrey presented a unique opportunity to understand the impact of lower speed limits on rural roads. Many areas within the east of Surrey have had the speed limit reduced below the national speed limit, whereas other areas have remained at 60mph. It means that some communities are familiar with lower rural speed limits.
Lastly, Surrey is in the process of a speed limit review, with the aim of implementing appropriate speed limits on all rural roads. There will be widespread speed limit reductions so this study provided an opportunity to a) explore compliance, safety, and attitudes on national speed limit and lower limit rural roads; and b) to analyse the new lower limits, which will be accompanied by publicity.

Blog by Tanya Fosdick
What did we do and what’s next?
The study uses a combination of quantitative and qualitative approaches and involved members of Agilysis’ Analytics and Research teams.
The objective is to understand the impact widespread rural speed limit reductions have on safety, and perceptions of safety amongst those using the roads.
Speed data came from two sources: ‘spot speed’ (speed surveys undertaken by Surrey County Council over the years, through permanent and temporary automatic traffic counters) and ‘link average speeds’ (telematics vehicle speed data, combined with a national speed limit map, distributed by Ordnance Survey). The combination of these two data sources was used to compare speed limits and speeds on roads in Surrey. STATS19 data on reported collisions, together with modelled traffic flow (obtained from raw vehicle counts and known ATC data) was used to assess collision density and collision rate on the selected rural roads.
Local residents were consulted to understand how they perceive risk and compliance. A survey was distributed which used questions from tools like the DfT Question Bank. Virtual interviews were conducted with interest groups and stakeholders.
In Phase Two, after an additional round of speed limit reductions have been implemented, new speed data will be analysed, and another survey will be disseminated to residents. Collision data will be considered, although it may not be possible to carry out a robust analysis with limited post-implementation data.
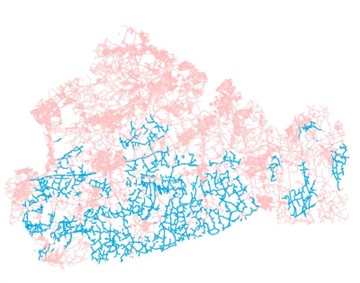
Figure 1 - Surrey's rural roads shown in blue
Isn’t it obvious what will happen when speed limits are reduced?
In some respects, yes – the analysis confirmed that higher speeds result in increases in collisions and that also, the public are generally supportive of lower speeds.
Collision rates on rural roads with lower average and 85th percentile speeds are lower than roads with higher average and 85th percentile speeds.
But it is not as simple as that.
Firstly, what is ‘rural’? For the sake of the analysis, roads were included in the analysis if they had a 40mph, 50mph or 60mph speed limit, were predominantly rural and have not had a change of speed limit recorded in the past five years. Predominantly rural is defined as being within 50m of a rural LSOA (settlement of under 10,000 people). This differs from the rurality classification used by the DfT.
But that doesn’t mean that all rural roads are the same. Road widths, sinuosity (curvature of the road and number of curves), and carriageway type can all differ. The sample roads included busy dual carriageways forming part of the major road network, high-traffic single carriageways linking large towns, similar roads but with less traffic between large villages, plus many smaller, narrow roads used predominantly by local traffic, cyclists, pedestrians, and equestrians.
And, of course, speed limits differ. The study looked at three different limits on Surrey’s rural roads.
These speed limits have changed over time, and there are some inconsistencies in speed limit allocation for roads that have the same nature. Roads which appear similar in nature have different limits, meaning that driver behaviour on some 60mph roads could be indistinguishable from many of those subject to 40mph limits.
Road users could identify roads as being similar because of traffic patterns, road widths, sinuosity, and gradient. But the speed limits could be different.
And lastly, compliance levels and speed choice are not necessarily consistent across different speed limits. So, lower speed limits don’t necessarily mean there will be lower speeds.
What did we find then?
Firstly, and most importantly, we confirmed the link between collision risk and high driven speeds.
The analysis demonstrated clear increases in collision densities when speeds were higher. This was even more prominent when 85th percentile speeds increased by one mile per hour. The most serious collisions (involving a KSI casualty) were even more greatly influenced by increases in speeds.
But the relationship with posted speed limits is more complicated.
Collision densities were highest in our sample of 50mph road sections, and lowest on our 60mph sections. The regression models showed that this difference in collision densities was statistically significant. Obviously, if vehicle speeds matched the posted speed limit, this result would be unexpected BUT the data showed that speeds on our sample of 60mph roads were frequently much lower than the limit. Furthermore, collision density doesn’t account for traffic levels – more traffic would normally be expected to lead to more collisions. The role of congestion wasn’t included in this analysis but the relationship between congestion and observed speeds will be explored in Phase 2.
Comparing the nature of the roads with different speed limits, we did not find significant differences overall in average road width or sinuosity, but it emerged that a larger proportion of 50mph roads were dual carriageways. There were also some 60mph dual carriageways within the sample where speed limits will have been set by a traffic regulation order, rather than being at the national speed limit for that road classification.
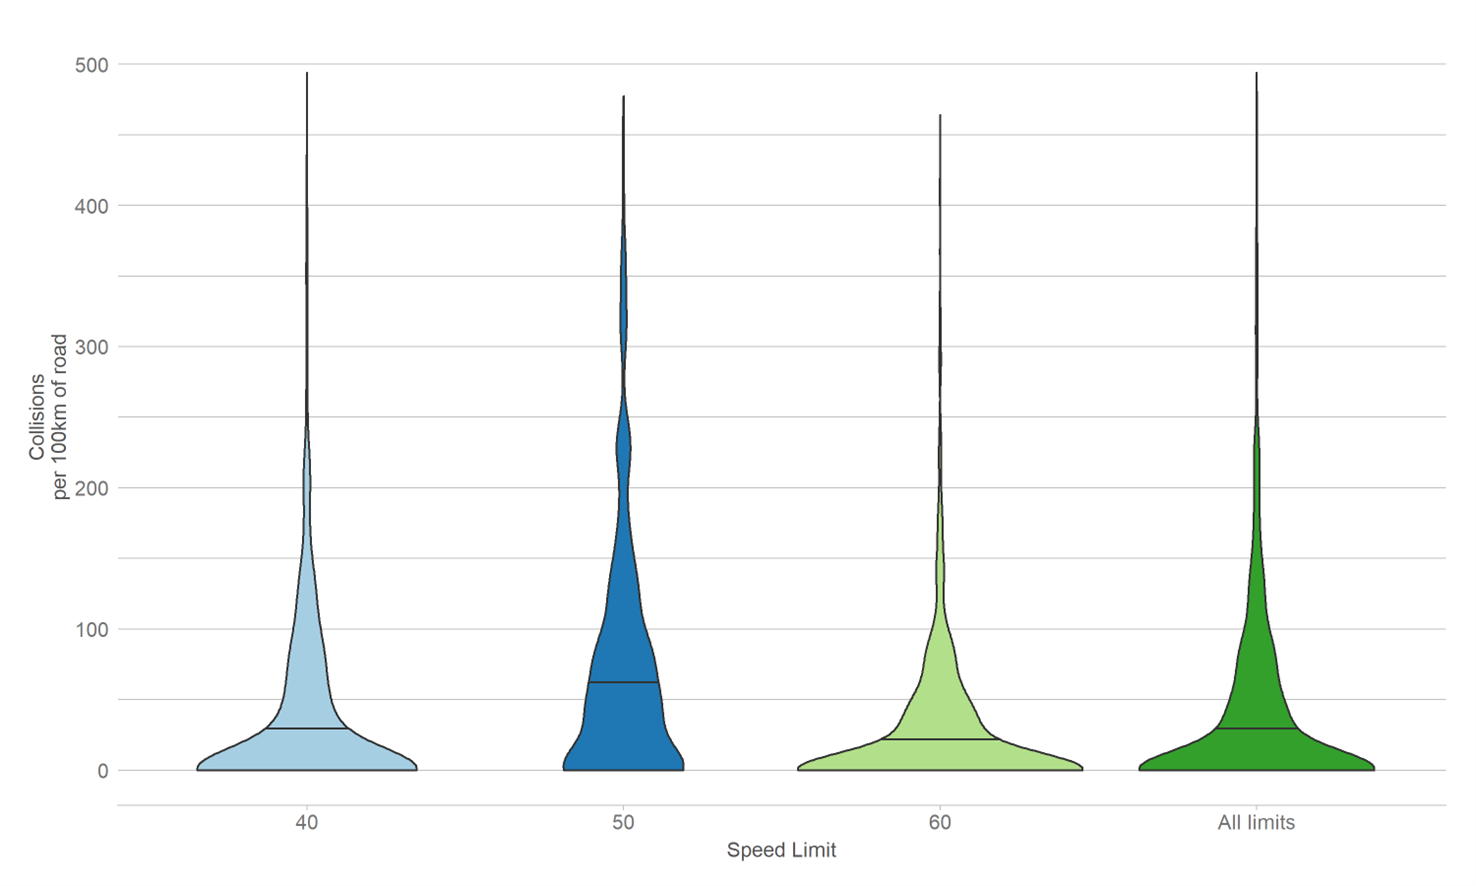
Figure 2 - Distribution of collision densities, split by speed limit (2015-2019)
What is going on?
Posted speed limits do not necessarily equal vehicle speed. As can be seen, the lowest average speeds are on roads with a 60mph limit, whilst highest average speeds are on 50mph roads. The same patterns hold for 85th percentile speeds.
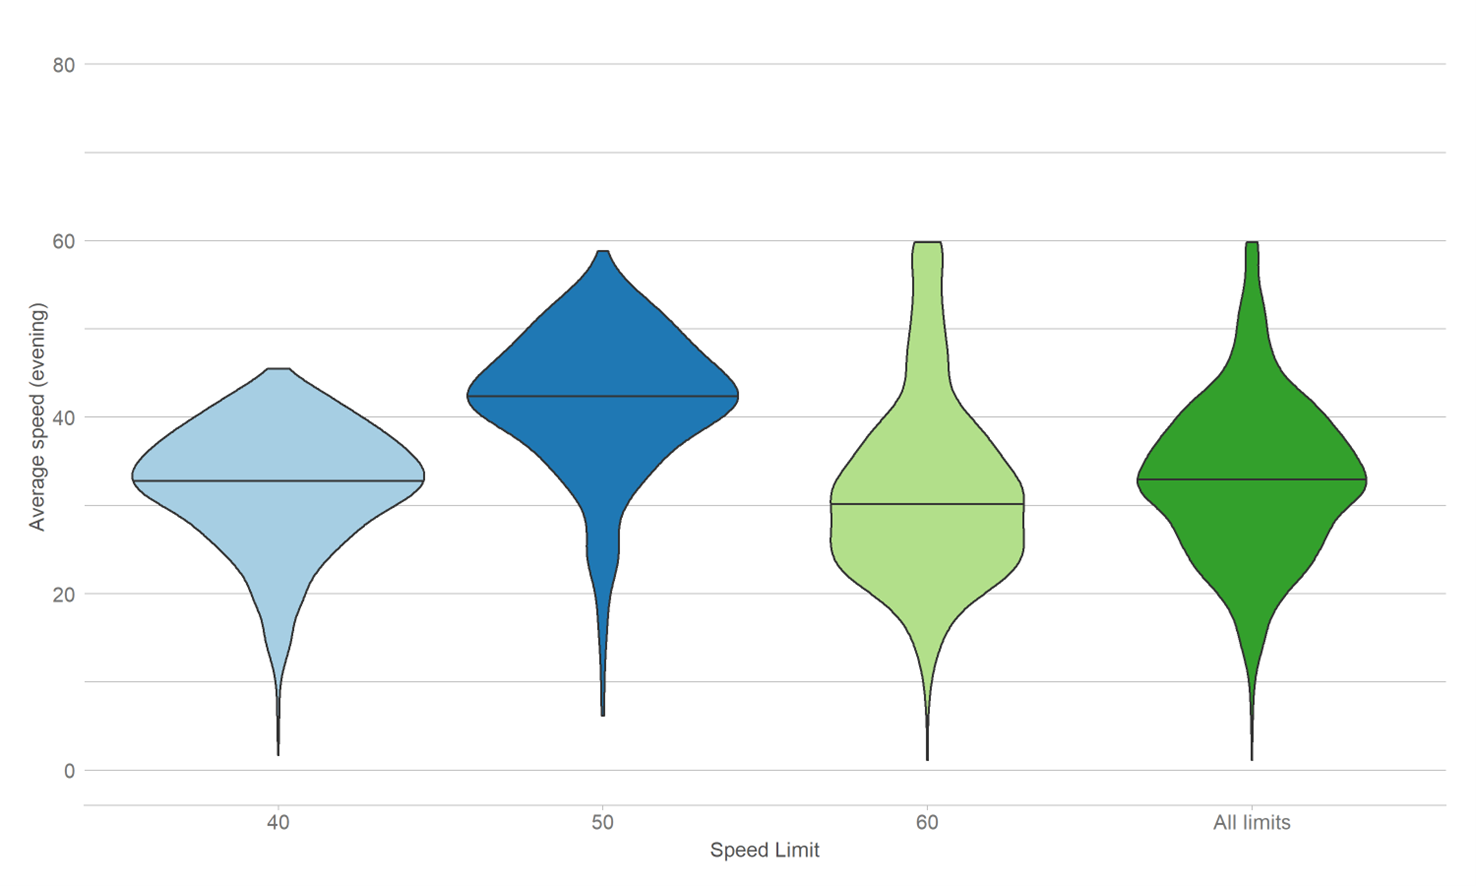
Figure 3 - Distribution of link average speeds, split by speed limit
We explored a range of factors to see if they were more common in particular speed limits, and therefore potentially contributing to vehicle speeds significantly lower than the speed limit (particularly in 60mph roads). These factors were: narrower road widths; higher sinuosity (curvature); and undivided carriageways.
Interestingly, average road widths, minimum road widths, and sinuosity did not greatly differ in the three speed limits.
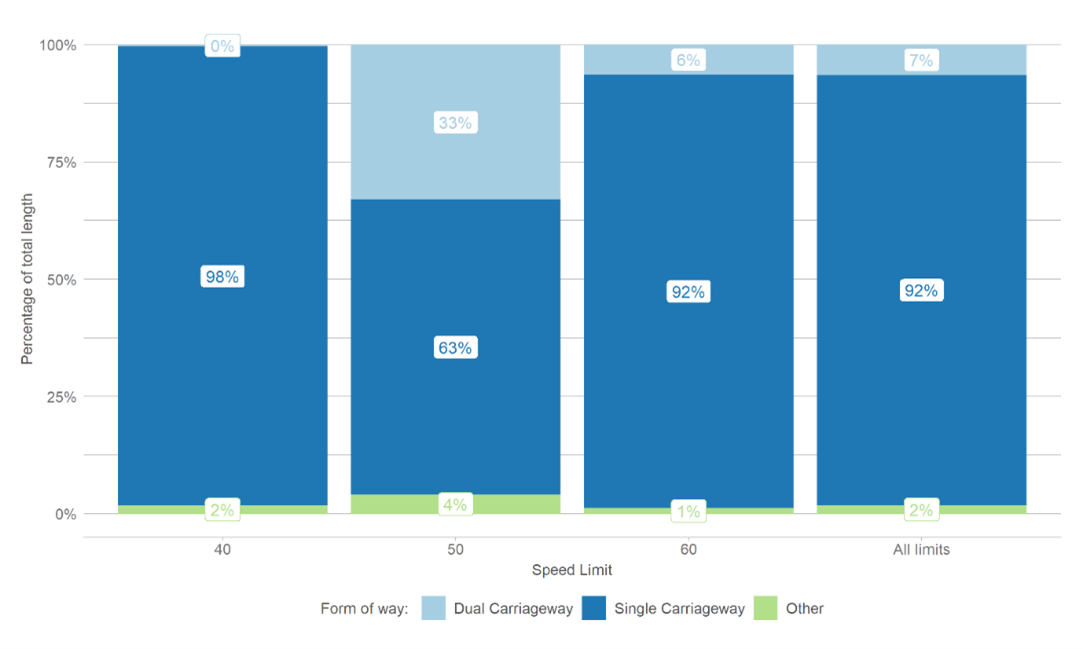
Figure 4 - Speed limits broken down by carriageway type
Carriageway type does seem to play a part, though. Average speeds tend to be considerably lower for single carriageway roads, compared to dual carriageway roads. This is unsurprising – undivided carriageways offer less protection, with dual carriageways commonly featuring barriers separating oncoming vehicles. This may therefore influence the speed at which a driver feels it is safe to drive, as well as not being restricted by slow moving vehicles.
A higher proportion of 50mph roads are dual carriageways, when compared to 40mph and 60mph roads. This could be partly responsible for the lower average speeds on the 60mph roads in our sample.
Whilst vehicle traffic and risk rates were not analysed, it was noted that there were very large collision rates on roads with low traffic flows. The presence of a single collision on a very low-flow road would create a very high rate, but similarly there were many road sections with no collisions at all.
Statistical modelling explored the relationship between average and 85th percentile speeds on rural roads and four different risk metrics:
- Collision density (the number of collisions per 100km of road)
- KSI collision density (the number of collisions in which at least one casualty was killed or seriously injured per 100km of road)
- Risk rate (the number of collisions per billion km travelled by vehicles)
- KSI risk rate (the number of collisions with a killed or seriously injured casualty per billion vehicle km travelled)
Modelling suggests that a 1mph increase in 85th percentile speed increases the KSI risk rate by 1.8%, collision densities by 2.4%, and KSI collision densities by 2.9%. Overall risk rate increases by 0.3% with a 1mph increase in 85th percentile speed (although the confidence interval suggests this is not statistically significant).
It suggests that greater speed differentials at the high-end is the biggest contributor to elevated risk, and that higher speeds tend to result in more severe collisions.
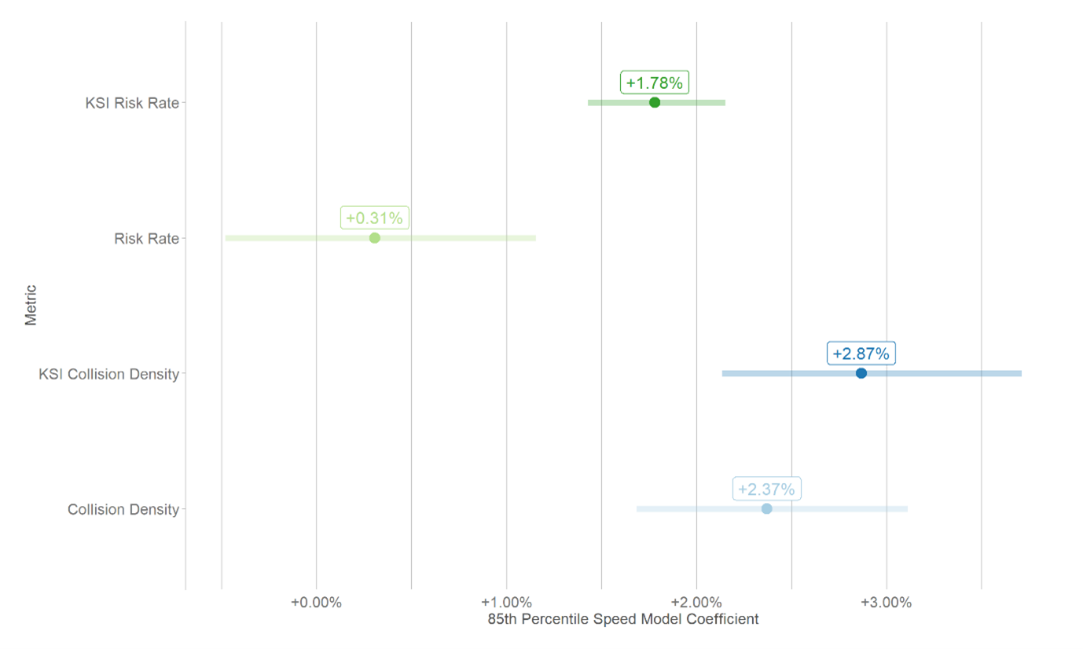
Figure 5 - Bayesian Poisson regression coefficients showing the impact on risk metrics from increases in 85th percentile speed
What do residents think?
Nearly 2,000 responses were received to a survey disseminated by Surrey County Council through its social media channels. Only 5% were not resident to Surrey.
It is disappointing to see that one in four residents could not correctly identify the national speed limit for cars. This is more common with older residents as well as young drivers. When explained however, the vast majority said that exceeding the limit would be dangerous. When asked if they would comply with lower rural speed limits results were again very positive, although young drivers reported a lower intention of sticking to a reduced limit. Perceptions of other drivers are poor, however, with the majority thinking that other drivers would not obey lower limits.
There is little difference between the residents of East and West of Surrey and their speed limit perceptions and attitudes. This could be a result of changes in the west of Surrey being implemented incrementally over a series of years and perhaps drivers and road users travel regularly between regions and have become accustomed to the changes.
Lower speed limits are generally well supported, and the public understand the risks of breaking the speed limit or travelling to fast for conditions, but the results indicate that residents believe a speed limit reduction on its own will not automatically lead to compliance with the new limit.
Interviews were held with cyclists, motorcyclists, and horse riders (although there were only two representatives of each of the latter two groups).
Taken as a whole, however, most interviewees (regardless of user group) agree that speed-limit reductions are not enough on their own and need to be accompanied by additional enforcement, education and awareness of road safety and responsibility when driving on rural roads. Engineering roads so they serve as effective and safe modes of transport for all types of road users is a priority expressed by interviewees, helping to make these roads more inclusive.
So what?
The report has identified and confirmed that higher speeds result in increases in collisions and that the public are generally supportive of lower speeds. It also notes that changing limits on their own may not necessarily achieve compliance. However, driven speeds on many rural roads are already much lower than the posted speed limit. The findings are in line with previous studies which show that average speed and speed variance are more important than the posted speed limit in determining safety.
The analysis does not indicate that further reductions in speed limits will increase harm if the new limits are selected in response to actual average and 85th percentile speeds. There will, therefore, be some roads where greater reductions in speed limit can be implemented compared to other roads.
Phase 2 of the study will explore how roads are selected for speed limit reductions and will review the effects of reductions to different limits. It will examine the effect on speeds and public perception of widespread speed limit reductions, and the role of publicity and enforcement on compliance with lower limits.


