REVIEWING THE GB ROAD SAFETY STATISTICS IN 2020
2020 saw a dramatic change in how we used the road network as drivers, pedestrians, and cyclists. This blog by CEO Richard Owen looks at what happened and how the changes can be explained, and questioned.
The last Thursday in June is one date that’s always pencilled into our diaries as it’s when the Department for Transport (DfT) release the Reported Road Casualties Great Britain (RRCGB) results. This is accompanied in September by the full results, which allows a much more in-depth analysis and also results in the annual MAST Online update.
This year more than ever we have been keenly awaiting the headline results as last year saw a dramatic change in how we all use the roads. Since last April, we have been reviewing data on changes in road use and driver behaviour and published research highlighting increases in vehicle speeds. We also analysed the six-month casualty data, focussing on changes during the first lockdown to look at how travel patterns were impacting on road casualties by user group, age, sex, and a number of other features.
The DfT have published their own analysis of the impact of lockdown on road casualties which provided a further update on the same trends previously observed. For those of you that haven’t read the official releases you should definitely check them out, especially as they are now available in an HTML-format for easier reading on mobile devices.
Countries all over the world have been publishing their results over the last few weeks and months and it’s always fascinating to see how we compare. The much-publicised stagnation in road safety performance in Great Britain has to a large extent been mirrored in Europe, for example. Our interest this year is how have the patterns changed in the UK and what, if anything, does this mean for future years?
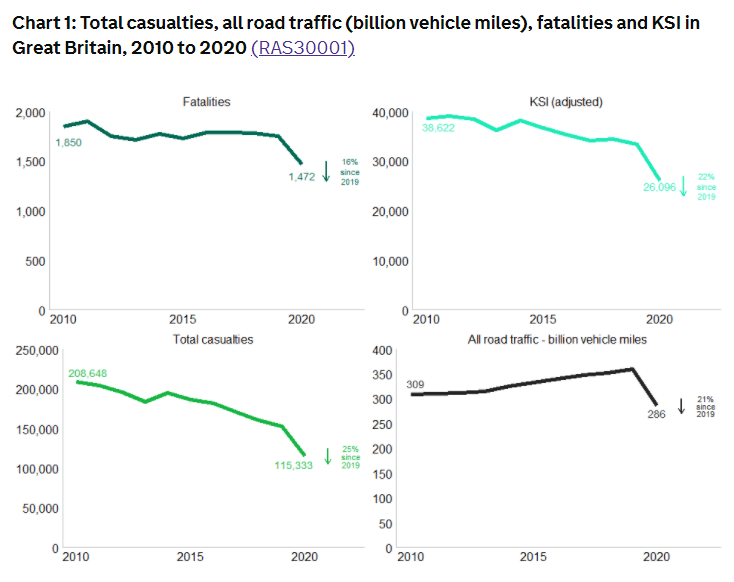
The first thing to mention is the absolute number of recorded road deaths. This is now the lowest figure ever recorded (1,472 compared to 1,730 in 2015) and a drop of 16% on last year's figure of 1,742. This must surely mean that our roads last year were safer than ever? Unfortunately that’s not quite true.
It could be argued that over the last year we (the public) have become much more engaged with statistics than ever before due to the frequent government COVID-19 briefings which contain information on the number of infections, hospitalisations, and deaths. At these briefings the experts have always been keen to express many of the metrics as rates. If Birmingham has 1,000 infections in a day is that better or worse than 1,000 infections in Newcastle-upon-Tyne? I think most of us would realise that Birmingham is a much larger city with a population nearly four times larger and therefore infection rates are much lower.
In road safety we have become more accustomed to using rates for measuring performance. On some levels using population statistics works quite well. Comparing large regions or countries makes a lot of sense but even then, the figures can be skewed by large proportions of road users moving from one area to another. For example, 92% of those injured on the roads in the South-West of England are ‘locals’ compared to only 84% in the East of England. Counting crashes in one area using the population of that area is therefore fraught with difficulties, unless you are looking at casualty residency (which is the way we do it).
The most accepted way of calculating a casualty rate it to look at exposure data, namely the distance travelled by mode each year. If we see an increase in traffic then, assuming no other changes have taken place, you would expect to see an increase in casualties. Of course, if we can improve road safety in terms of safe roads, safe vehicles, and safe road users then we would hope not to see a commensurate rise in casualties.
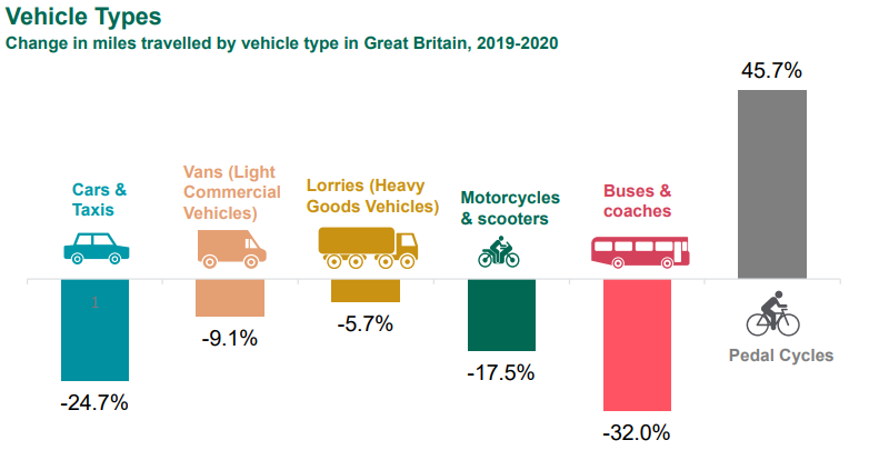
In 2020 we saw an unprecedented drop in road traffic with a 21.3% reduction in miles driven. Within those statistics it’s possible to break down the figure for different road user groups including cars and taxis, goods vehicles, motorcycles, and pedal cycles. Information on pedestrian movements is not published in this data series however. As you are probably aware, there was one mode that saw an increase in miles travelled; cycling. Here we had a 45.7% jump in the figures as many of us sought alternative ways of getting around, be it for work or pleasure.
This brings us back to the 2020 road casualty information. Yes, we saw a drop in deaths but it wasn’t as great as the drop in traffic which means that the fatality rate per mile travelled increased by 6% last year. If you look at the total number of casualties, and indeed those who are seriously injured then the rate did fall, more or less in line with the rate reductions we have seen over the last decade. Despite the stagnation in overall reductions on those killed on the roads, the safety rate has been improving slightly. This still isn’t the kind of progress we should be making if we have an ambition in line with Vision Zero.


The fatality data does show a huge 40% increase in cyclist deaths. Over a third of these happened in the ‘lockdown months’ of April – June when we saw the biggest rise in cycling, which was associated with quieter roads and largely fair weather. When the 45.7% increase in cycling is taken into consideration however this means that ‘cycling became 14% safer’. A similar picture can be seen for good vehicles which didn’t see a very large drop in miles travelled (-9.1% for light goods, -5.7% for heavy goods) whereas there was a reduction on good vehicle casualties (the drivers predominantly) of 18.2%.
But hold on, aren’t we missing something here? Are we really saying that the only thing impacting on cyclist and HGV deaths are the miles travelled by that specific mode? If there are more people cycling on the roads but there are fewer vehicles, surely we would expect the numbers not to rise just based on the traffic associated with that mode? Cyclists do injure themselves of course but predominantly they are killed in collisions involving a motor vehicle. Evidence from the PACTS ‘What Kills Most on the Roads’ report from last year, to which we contributed, shows that only 14% of pedal cyclist deaths in 2019 didn’t involve another vehicle. Does this mean that we should only allocate a 14% weighting to the cyclist traffic figure? Well, that doesn’t seem quite right either and we probably do need to wait for the more detailed results to be published so we can understand the circumstances of those 140 tragic deaths in more detail.
The same can be said for age-group analysis too. We saw larger reductions in fatalities for older drivers, almost certainly due to reduced exposure as a result of self-quarantine for much of the year. It could be that there are a large number of explanations for the reductions we have seen and perhaps these all outweigh the effects of reduced traffic. Even though we would normally want to celebrate such a significant reduction in road deaths it seems far too soon to be certain that our roads are actually any safer at all.


