What happened to road casualties during the COVID-19 Lockdown 1.0?


What happened to road casualties during the COVID-19 Lockdown 1.0?

March 4, 2021

What happened to road casualties during the COVID-19 Lockdown 1.0?

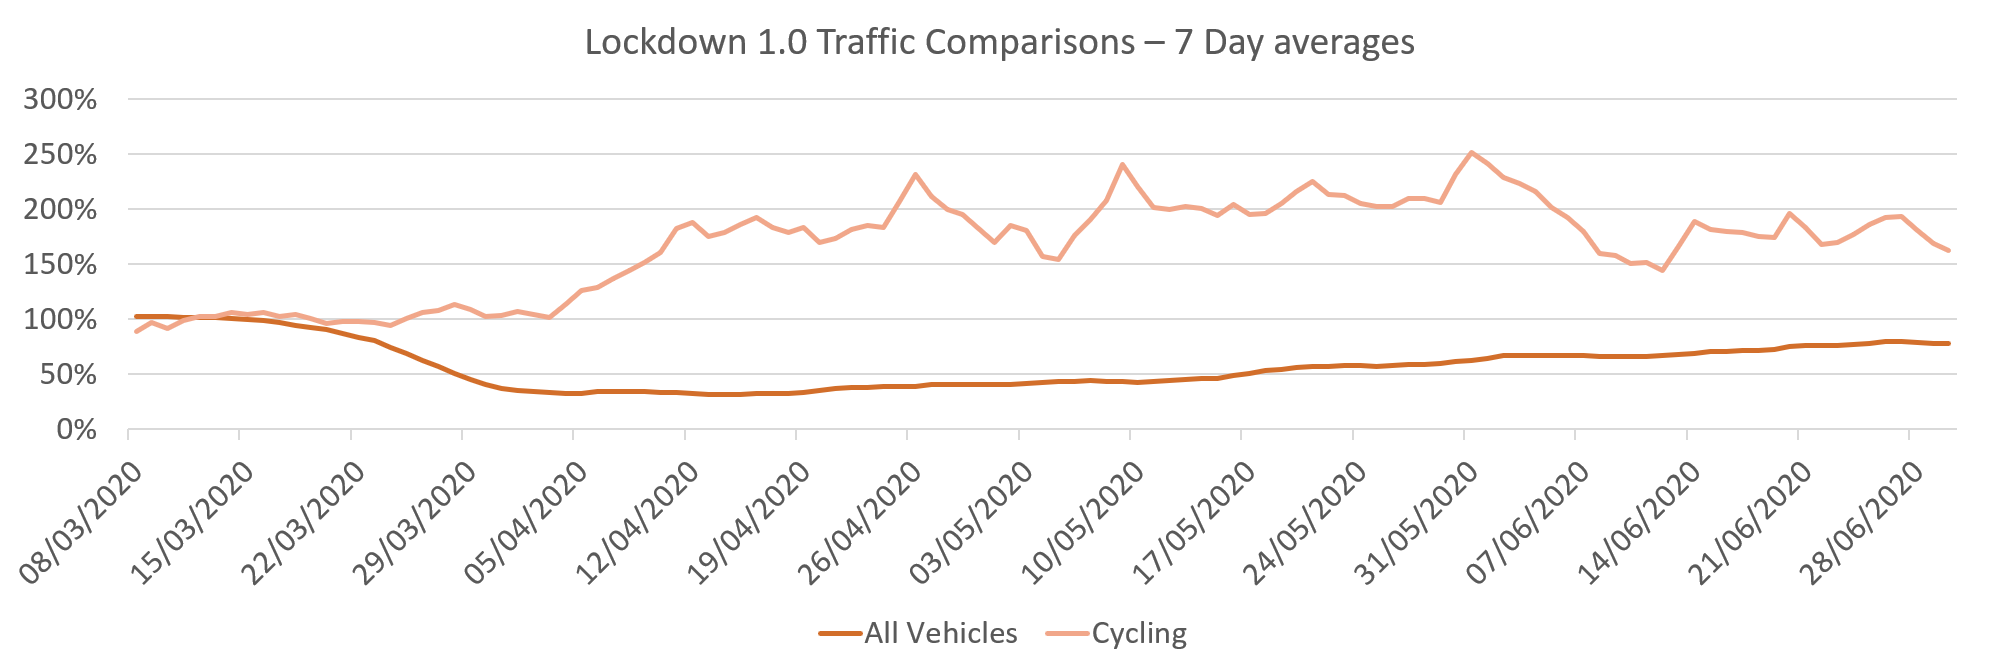
At the 2021 ‘Joining the Dots’ road safety analysis conference on 2nd March, our CEO Richard Owen gave an overview of some analysis undertaken using MAST Provisional for the period March – June 2021. This is analysis that anyone with access to MAST can undertake and I volunteered to do this on a national basis to help people understand what happened, and the potential pitfalls when analysing ‘provisional’ data.

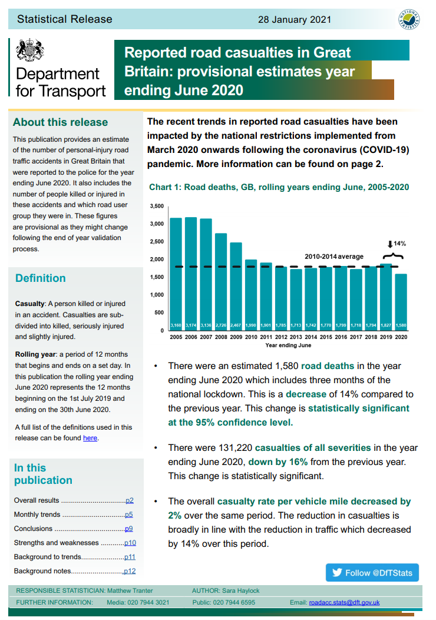
The DfT published the ‘provisional estimates’ on 29th January 2021. This focussed on a 12 month mid-year comparison for the year ending June, going back to 2005. This also includes an estimation of ‘missing’ data from the most recent period. There is a huge amount of uncertainty, although previous year’s estimates have been broadly in line with the final figures.

In recent years there have often been large gaps in the data for individual police forces which has delayed publication. As to be expected, in 2020 there were gaps in several areas with either completely missing data or levels of under-reporting that were far beyond those seen in other police force areas.

What happened to road casualties during the COVID-19 Lockdown 1.0?
Department for Transport provisional estimates report

View

Police forces with entire months missing:

Gwent Police (April - )
Northamptonshire Police (Jan - )
South Wales Police (May - )
Wiltshire Police (Feb - )

Police forces with considerable under-reporting
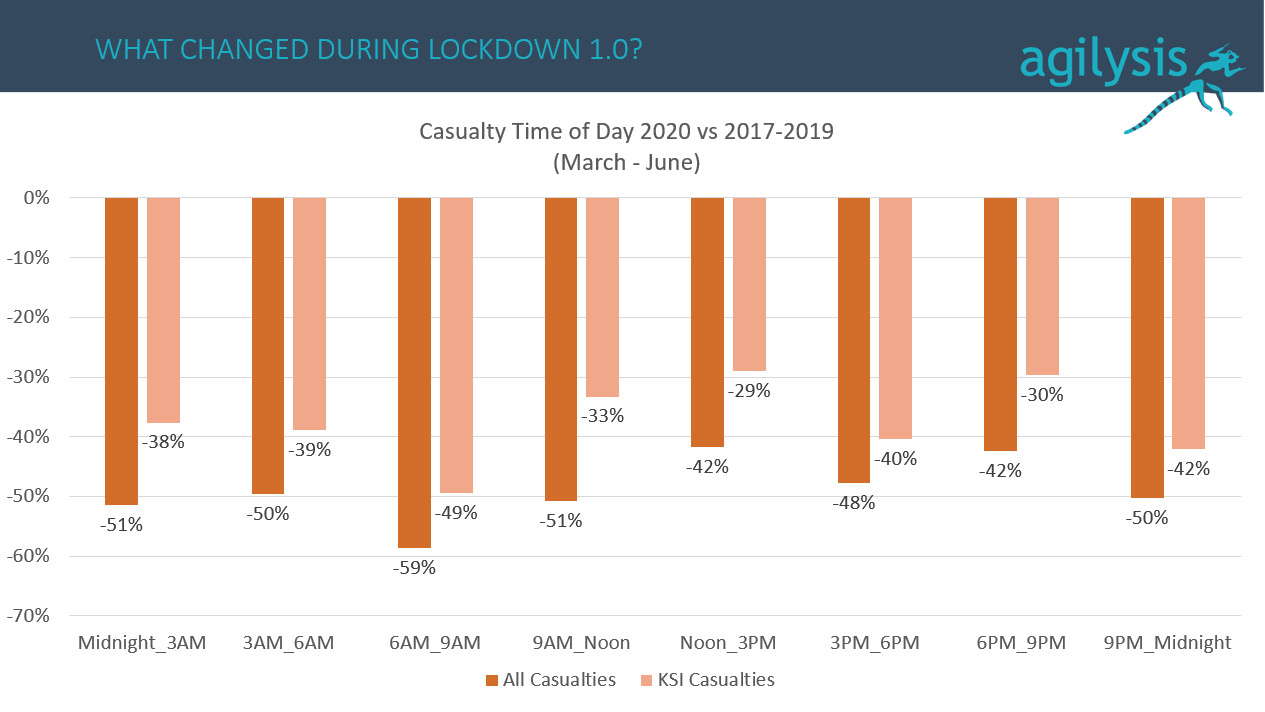
(>1 standard deviation below mean)
Avon & Somerset (April - )
North Wales Police (Jan - )
These forces were then removed from the following analysis of March – June 2020 compared to the three-year averages for the same months between 2017 and 2019. This still left us with a sample for 2020 of 25,560 casualties, 5,299 of which were killed or seriously injured.

What happened to road casualties during the COVID-19 Lockdown 1.0?
Transport use during the coronavirus (COVID-19) pandemic
To monitor the use of the transport system during the coronavirus (COVID-19) pandemic. DfT provides statistics on transport use by mode. This chart is produced based on this data which can be accessed using the link below.

View
The following results should be taken in context with the drop in traffic levels. I reviewed the average change over the period using the published DfT data and for the entire four month period motorised traffic was down 39%, by cycling was up 68%. No evidence is available on pedestrian movements, although evidence provided at the JTD2021 conference suggested that ‘High Street’ pedestrian movements dropped sharply, with lower falls in residential areas.

All of the figures quoted in the rest of this report are a percentage change in reported casualties for the period March – June 2020 compared to the same period in 2017-2019 excluding those named police forces above.
48% down

All casualties

37% down

KSI casualties

57% down

Female casualties

43% down

Male casualties

All casualties were down more than killed and seriously injured casualties (48% vs 37%). This trend is seen for all subsequent analysis by age, user group, transport mode etc. This has been seen in other parts of the world too.

Reductions were greater for females than males which indicated that fewer women were using the roads during lockdown, possibly as they were more involved in home schooling.

Reductions by age group were greatest for children and those over the age of 75, most likely reflecting the closure of schools and instructions to shield for those over the age of 70. The drop in KSI casualties for those in the 16-24 age group was more significant that for other age groups.

A time of day analysis showed a more significant drop in casualties during the morning peak period (6am – 9am) with less reduction in the inter-peak periods. No significant changes were observed by day of week.

Reductions were greater on motorways than other road classes, and this was also seen when analysing roads by speed limit. The major outlier in the analysis was a much lower drop in casualties in 20mph limits. This could reflect two things; the increasing length of 20mph limits in 2020 compared to the previous period; lower reductions in traffic and increased active travel in residential areas where 20mph limits are more common. A better analysis would require a collision density or crash rate analysis using road lengths and traffic counts.

Casualty reductions by age

    • Under 5yrs60%
    • 5-15yrs64%
    • 16-24yrs48%
    • 25-34yrs43%
    • 35-44yrs45%
    • 45-54yrs47%
    • 55-64yrs42%
    • 64-74yrs52%
    • 74-84yrs61%
    • 85yrs+62%

What happened to road casualties during the COVID-19 Lockdown 1.0?
Slide pack containing charts available

Download

Reductions by transport mode largely reflect the types of vehicles being used on the roads in this period. Bus casualties dropped most significantly, followed by car users. Goods vehicle casualties dropped by only 40% compared to the all casualty average of 48%. Motorcycle casualties also didn’t drop as significantly and a more detailed casualty rate analysis would be required to understand why this was the case. Motorcycle casualties are influenced by good weather conditions, which were in place for much of the analysis period.

Pedestrian casualties did reduce significantly which is likely to be a combination of reduced pedestrian movements, as well as few vehicles. Cyclist casualties dropped the least but this should be put against a backdrop of an increased amount of cycling. It is likely that a rate-based analysis would show that cycling became significantly safer during the analysis period.

Pedestrian conflicts were analysed to see if there was a change in the vehicles that struck an injured pedestrian. These were broadly in line with the figures seen for in-vehicle casualties, with the exception of cycles. This indicates that cyclist vs pedestrian incidents did not become a problem during periods of increased active travel.

Casualty reductions by road user

    • Pedestrian59%
    • Car52%
    • Motorbike39%
    • Goods40%
    • Bus76%
    • Cycle21%

Finally it is worth noting the differences in casualty reductions in forces using alternative recording mechanisms. Reductions were lower in forces using the CRaSH system, rather than those using alternative systems. This is an interesting phenomenon worthy of further investigation once the full data is available.

It is important to state that there are several potential problems with this analysis. The first is the fact that we are missing several large police forces and for those that did report, there will still be missing collisions. Once we have a complete dataset this exercise can be re-run but this will not be until the autumn. As mentioned, accessing exposure data will provide a more robust analysis of risk rather than counts. Using severity-adjusted data will also help to analyse the more seriously-injured casualties across the country.

There are further elements we would wish to see reviewed. It is possible to analyse the relationship between casualties and community profiles, so reviewing deprivation and potentially ethnicity would be of interest. Rural and urban differences, as well as those around the regions is high on the priority list for future analysis as would be the impact during other restrictions later in the year and into 2021.

One of the unanswered questions about these results is what do they mean for the future and was lockdown 1.0 very different to subsequent periods? Are these trends going to disappear? Will the ‘new normal’ be the same as previous patterns or will we see something similar to the results in Lockdown 1.0? What is clear is that reduced traffic levels have an impact on road casualties and these results should be considered by local authorities and police forces when carrying out their statutory duties in 2021.

Supporting tables can be accessed through this Excel Workbook

Related News

July 10, 2024

Popular Safe System survey returns with fresh new perspective

Now into its third year, Agilysis is relaunching the national survey to better understand the state of Safe System implementation throughout Britain. This year, we are introducing a fresh perspective by focusing on culture maturity to assess how well-equipped we are to build capacity and drive progress in road safety.
June 26, 2024

Enforcement technologies – changing hearts and minds through a new Safe System lens

As we look to the future, the integration of connected and autonomous vehicles (CAVs), mobility-as-a-service (MaaS), and novel enforcement technologies like passive alcohol detection and speed-limiting geofencing, highlight the ongoing need for strategic, systemic approaches to transport safety. Embracing behavioural measures and leveraging new technologies can further advance our goal of safe, sustainable, and equitable mobility for all.
June 13, 2024

Why do we need 20mph?

Explore the transformative impact of 20mph speed limits with insights from Wales and beyond. Recent data reveals a significant reduction in road casualties following the implementation of 20mph limits in Wales, underscoring their potential to enhance road safety. Agilysis's Traffic Insights report using connected vehicle data highlighted a 2.4mph reduction in average speeds. This aligns with the broader trend of adopting Vision Zero and Safe System methodologies, which prioritize human safety by setting speed limits that reduce fatality risks for pedestrians and cyclists. Discover how these changes are making roads safer and what further measures can be implemented for greater impact.

Contact us

Contact us to discuss your specific needs
info@agilysis.co.uk
+44 (0) 1295 731 811
X