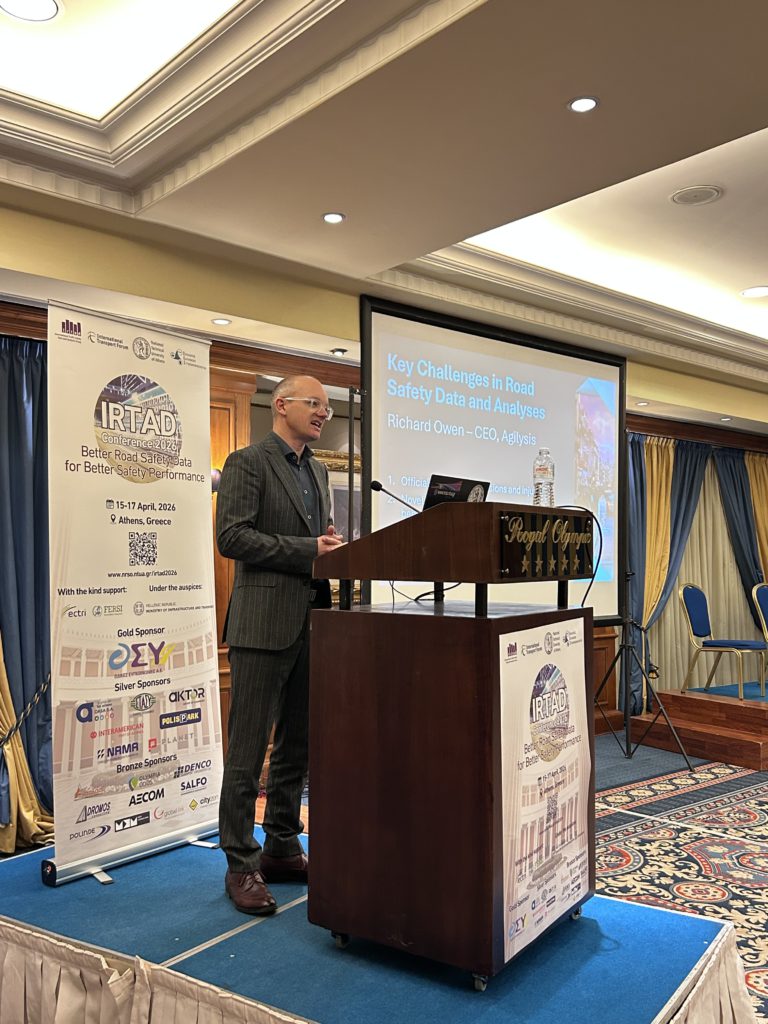
The 2026 IRTAD Conference in Athens brought together 141 research papers under the theme "Better Road Safety Data for Better Safety Performance. The role of international road safety data in local best practice," a clear message emerged: the road safety community is fundamentally shifting from reactive collision analysis toward proactive risk assessment. This transformation, evident across presentations from Agilysis colleagues and international partners, represents both the field's greatest opportunity and its most complex challenge.
The core message resonated throughout the conference: if we only use historic collision data, we will never achieve Vision Zero. The Safe System approach demands proactive identification of risk, not reactive analysis of tragedies already occurred.
This shift in approach was reflected across multiple presentations. Our analysis of speed compliance using connected vehicle data in Great Britain demonstrates how floating car data can provide real-time safety performance indicators without waiting for crashes to occur. Similarly, our work with the Asian Development Bank in Thailand and Maharashtra, India, showed how commercial GPS data and crowdsourced imagery can compute safety performance indicators at national scale without traditional roadside surveys.
The practical implications are profound. In Maharashtra, we discovered passenger helmet wearing rates of just 1% compared to Thailand's 71% — insights impossible to obtain through conventional crash analysis but critical for targeted interventions. This represents the evolution from asking "where did crashes happen?" to "where are crashes about to happen?"
Our team's contributions to IRTAD 2026 showcased the breadth and depth of Agilysis' methodological leadership. Across eight presentations, we demonstrated how novel data sources, advanced analytics, and practical policy applications converge to enable evidence-based decision making.
Speed and Compliance: A Strategic Focus
Speed emerged as a dominant thread through our work. Drishti Khatri's presentation on measuring speed limit credibility introduced a novel index quantifying the alignment between posted and driven speeds. Applied to 968 road segments via our Speed Compliance Tool, this work provides highway authorities with geospatial targeting capabilities for speed limit interventions. The credibility index — ranging from 0 (total mismatch) to 1 (perfect alignment) — offers a data-driven foundation for the often politically sensitive question of speed limit setting.
Our floating car data synthesis paper with Jiri Ambros and Jan Elgner from the Czech Republic provided an honest assessment of what we know and don't know about this rapidly expanding data source. While highlighting established applications in safety performance monitoring and intervention evaluation, we acknowledged four critical open questions: reliability across data providers, validity against ground truth, the impact of sample characteristics, and handling temporal-spatial speed variations. This methodological transparency strengthens rather than weakens the field's credibility.
Novel Data Sources for Traditional Challenges
Suzanne Coles presented our work identifying sparse residential development areas that warrant speed limit review despite not being classically urban. Using OS AddressBase Premium, GRUMP urban polygons, and Indicative Speeds data, we developed a geospatial method to identify "place" character that justifies speed reduction even in rural contexts. This demonstrates how sophisticated data fusion can operationalize complex planning concepts like the place-versus-movement framework.
Our collaboration with Stelios Efstathiadis showcased AI techniques for deriving road safety attributes in Africa. Combining Earth Observation satellite imagery, OpenStreetMap, and Mapillary street-view data, we successfully identified operating speeds, pedestrian presence, and carriageway separation across 75% of the travel networks in Kenya and Ethiopia. For low- and middle-income countries where on-ground surveys are impractical, this work demonstrates how AI can democratize access to safety assessment capabilities.
Critical Evaluation of Data Quality
Perhaps our most important contribution was Nathan Harpham and Bruce Walton's analysis of STATS19 data collection practices with DfT colleagues. Their two-phase study sought to bring greater understanding of how data collection, and changes to the dataset, have implications for analysts using it.
The first phase of the study involved engagement with most police forces in England and Wales to understand current reporting practices. Several key themes emerged including the desire for more training and quality assurance. This work has been informing engagement with forces and other follow up actions for the DfT.
The second phase was the first national assessment of the impact of the move to Road Safety Factors (RSFs) which have replaced the old Contributory Factors (CFs). There are clear implications for long-term trend analysis, with speed-related factors dropping 8% nationally and "aggressive/dangerous/reckless" coding declining 19% between 2022 and 2024. Through officer interviews, several influencers on data collection practices were identified, including system interfaces, the ordering of factors, local culture and consideration by officers of potential implications of selecting different factors.
Gender and Vulnerability: Revealing Hidden Patterns
Tanya Fosdick's analysis of gender differences in crash risk revealed systematic patterns hidden by aggregate statistics. While men are 2.24 times more likely to be killed or seriously injured overall, older women show increasing over-representation with age, despite declining exposure. The finding that vehicle safety systems designed around male crash test dummies are less effective for women highlights how apparently neutral technologies can embed systematic disadvantage.
Combined with trauma research showing female casualties are more frequently trapped and sustain different injury patterns (more pelvis and spine injuries versus male head and chest injuries), this work demonstrates how disaggregated analysis reveals critical vulnerabilities invisible in population-level statistics.


