The Department for Transport recently published its provisional 2025 road casualty statistics for Great Britain, and the results mark a clear turning point for how road safety performance should be understood and managed over the next decade.
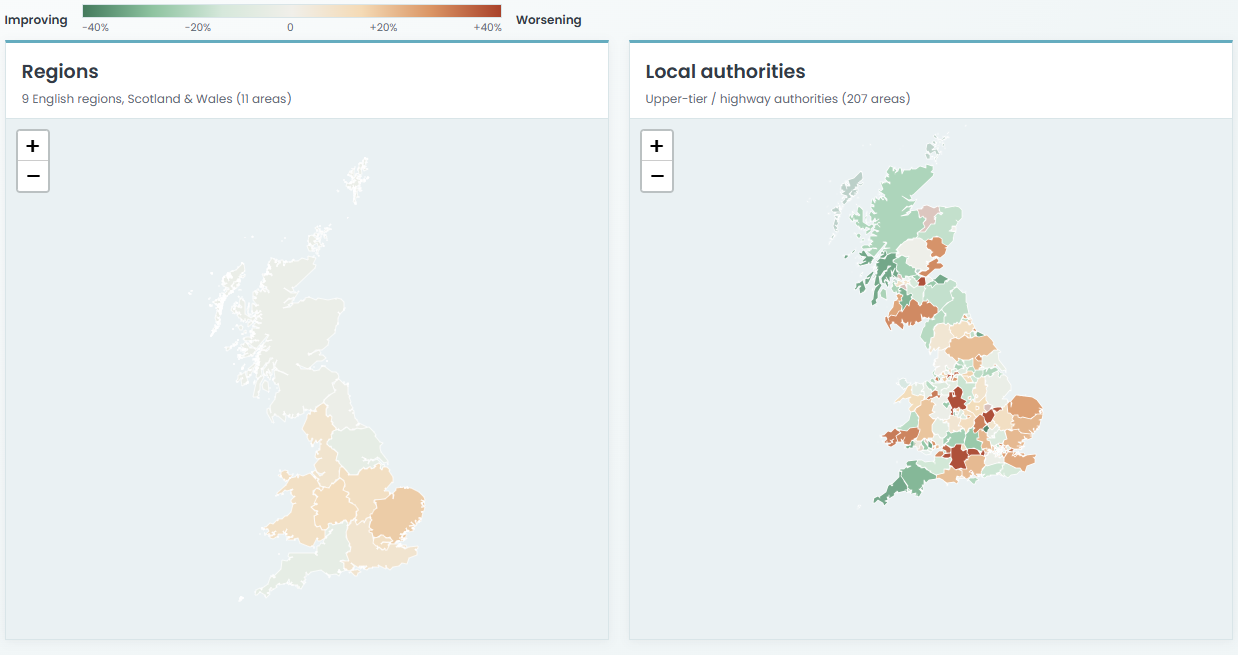
We have analysed the data and developed an interactive dashboard to support practitioners in exploring trends, comparing performance and understanding the importance of interpreting the data.
The most striking feature of the 2025 data is that the three-severity series are no longer moving together:
- Fatalities fell to 1,556, down 3% on 2024 and 11% on 2019, continuing a long‑term downward trend.
- Killed or Seriously Injured (KSI, adjusted) rose to 29,911, up around 4% year‑on‑year and now slightly above pre‑pandemic levels.
- All casualties remained broadly flat year‑on‑year, but are 16.5% lower than 2019, largely driven by a sustained fall in slight injuries.
This divergence matters. It means the familiar narrative of uniform improvement no longer holds. While deaths continue to fall, serious injuries are rising.
Where risk is highest
The clearest adverse signal in 2025 is for motorcyclists. Fatalities increased 13% year‑on‑year, the second consecutive rise, and are now well above both 2019 and 2015 levels. While annual volatility is high, two years of increase warrant close attention and careful testing against exposure.
By contrast, pedestrian fatalities fell 9%, reaching their lowest level in over a decade, although pedestrian KSI rose slightly. Car occupants continue to drive much of the long‑term improvement, accounting for the largest share of casualty reduction since 2019.
Cyclist casualties rose 10% year‑on‑year, with KSI up 14% but fatalities broadly unchanged. In the absence of exposure data, this could be interpreted as reflecting a rebound in cycling activity rather than deterioration in risk alone.
An ageing risk profile
One of the most important structural shifts in the data is by age. The 60+ age group is now the only band with KSI above pre‑pandemic levels, up 15% on 2019, with fatalities also increasing year‑on‑year. Meanwhile, casualties among the traditional “young driver” cohorts continue to fall.
This aligns with wider demographic change and reinforces the need for Safe System design that better protects older drivers, riders and pedestrians, particularly through speeds, junction design and vehicle safety.
Why exposure matters
A critical limitation of the published tables is that they present counts without exposure. When adjusted for traffic growth, underlying safety performance looks slightly better than the raw numbers suggest, but rising KSI casualties remain a genuine concern.
For vulnerable road users in particular, vehicle miles are an imperfect measure. Understanding whether harm is increasing because people are travelling more, or because risk per trip is rising, remains essential for targeting effective interventions.
Implications for the new road safety strategy
These findings come at a critical time. The new national road safety strategy sets out an ambition for a 65% reduction in casualties by 2030, building on a 2022–2024 baseline and grounded in Safe System principles.
Against that backdrop, a rising KSI series in 2025, particularly among motorcyclists and older road users, represents an early warning signal. It reinforces three practical priorities for data interpretation:
- Focus on KSI, not just fatalities, as the primary measure of harm due to smaller numbers, especially at a local level.
- Use multi‑year averages at the local and police force level to avoid misleading conclusions from small numbers.
- Embed exposure and uncertainty explicitly when interpreting trends and setting targets.
The Agilysis’ 2025 casualty dashboard is designed to support exactly this kind of evidence‑led conversation, helping authorities and partners align investment, policy and design decisions with Safe System outcomes. This is the first in a series of planned tools we will be delivering to the sector in the months ahead.


